Troubleshooting: Diagnostics, Errors, and Logs
We work hard to ensure that CodeScene just works. This means you point CodeScene to your codebase, press a button, and get the analysis results.
If you’re facing an unexpected issue or application behavior, you can use detailed analysis diagnostics and logs to gather more data and share them with Empear support.
Analysis Errors
On the rare occasion when an analysis fails, we make sure you know about it so that you can take corrective actions.
On the main landing page, CodeScene displays two kinds of notifications:
The first notifications, with the triangular warning sign, are not for troubleshooting CodeScene. They concern the codebases being analyzed: CodeScene has detected something that requires your attention. It’s time to check the analysis dashboard.
The second kind indicate that there was a problem when running the analysis.
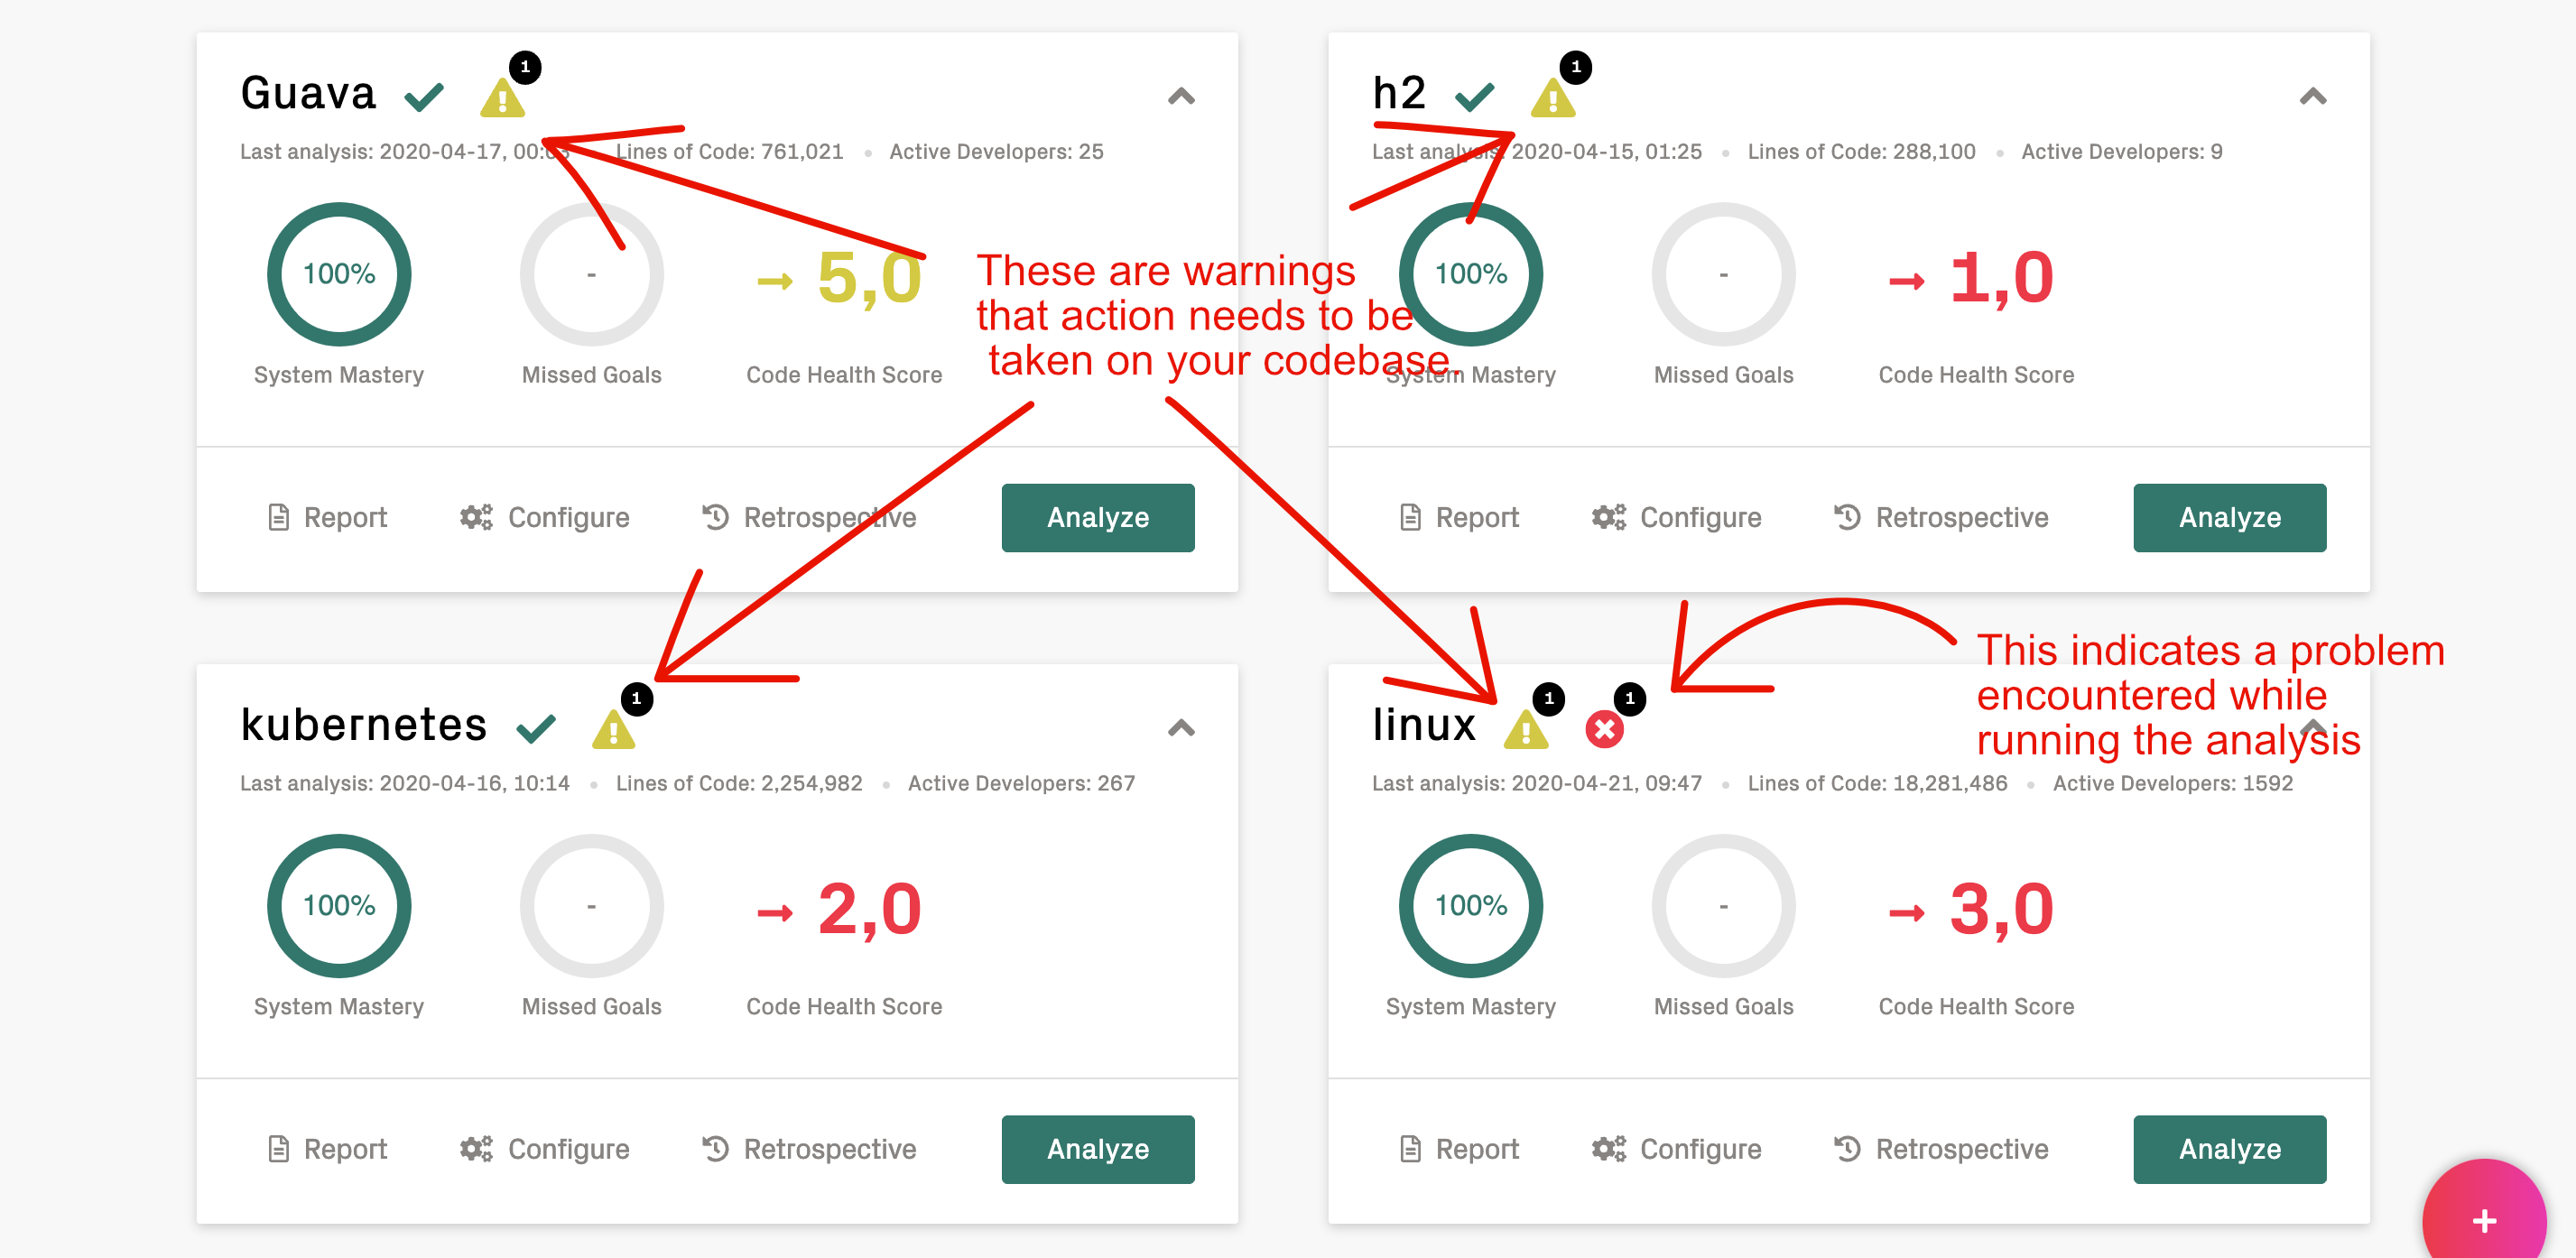
Fig. 7 There are two kinds of notifications on the main landing page.
When you click on the analysis error icon, you can see what the problem or problems are.
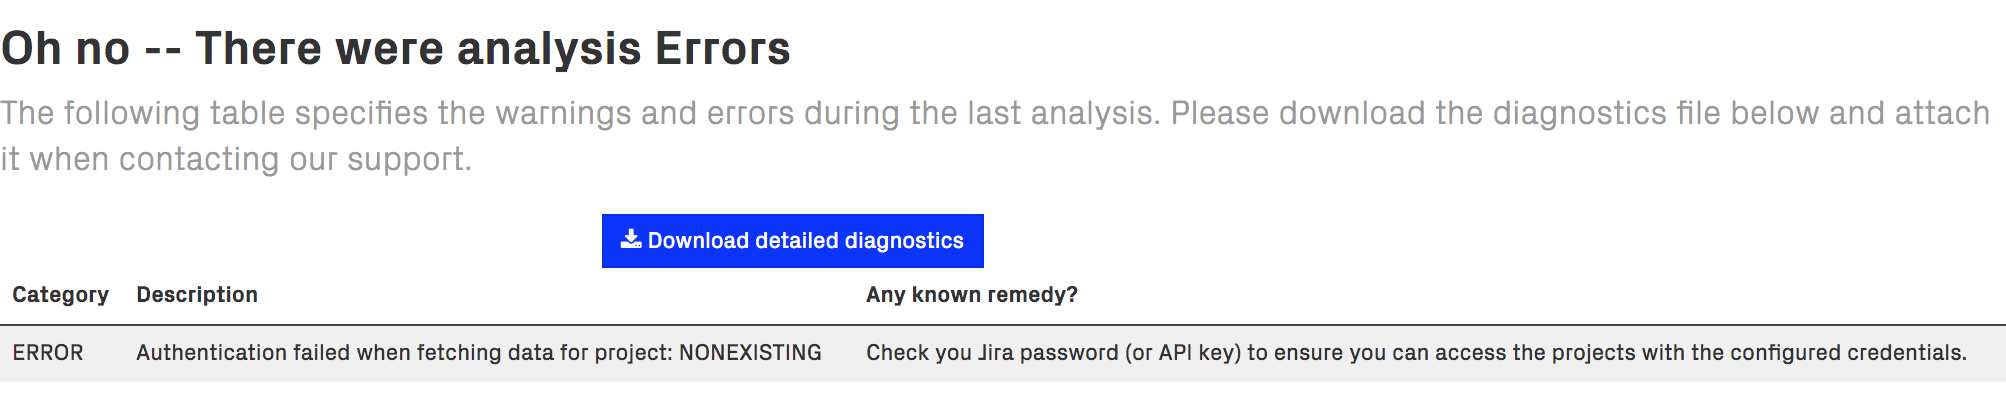
Fig. 8 Click on the warning and error icons to retrieve the detailed diagnostics.
We distinguish between errors and warnings during an analysis:
Errors: An analysis error means that we couldn’t complete the analysis since we didn’t manage to fetch all the data we need. This is often due to an external data source that isn’t available. Examples include 3rd party integrations such as Jira.
Warnings: A warning means that the analysis completed but we did identify some conditions that requires your attention. A common example is that the Git repositories couldn’t be updated, which means that your latest code changes might not be reflected in the analysis. Another example might be parser errors when scanning the source code.
We do our best to keep the error messages informative. Please get in touch with our support if an error message or remedy isn’t clear – we consider error messages that are hard to understand an internal error, and love the opportunity to improve them. Click on Download detailed diagnostics to retrieve a file that can be shared with Empear for further inspection.
Logs
CodeScene logs contain important clues about errors and the application behavior and it’s always a good idea to attach them to your support requests.
Where can I find the logs?
CodeScene logs to standard output.
The way you retrieve logs depends on how you run it:
Standalone JAR: standard output - you may want to redirect it to a file.
Docker container: retrieve logs via the
docker logscommand.Tomcat: logs are stored in the
<TOMCAT_HOME>/logs/directory. There’s usually a single big catalina.out file which contains aggregated logs from the beginning or a particular point in time (after you cleared the log). There are also many localhost.YYYY-MM-DD.log files which can contain other useful information, especially about deployment-time errors.
Log levels
The default log level CodeScene uses is INFO.
To enable more detailed logging you have two basic options:
Set
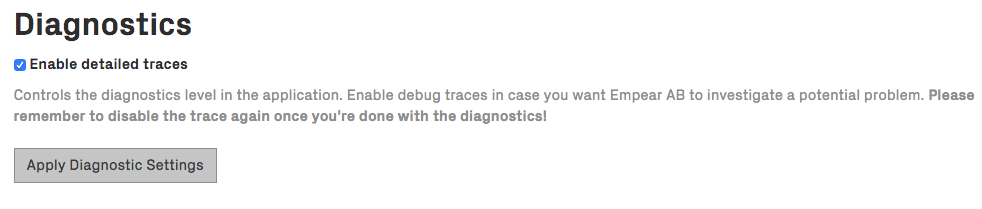
CODESCENE_LOG_LEVELenvironment variable: supported levels are ERROR, WARN, INFO, DEBUG, TRACE. INFO is a good default level but make sure to check the volume of logs CodeScene generates. This setting requires a restart.Check Enable detailed traces in Configuration -> System, as shown in the next figure. Note that this sets log level to TRACE which is very verbose. It’s useful for a temporary debugging session. This setting doesn’t surive a restart.
Special debug logging
This can be used in edition to log levels mentioned in the previous section.
There are couple of options useful for specific use cases.
Logging HTTP request/response bodies
A special log config variable CODESCENE_LOG_HTTP_BODY (‘false’ by default) can be set to ‘true’ for logging HTTP request/response bodies. It can be useful for temporary debugging of tricky issues.
To have an effect, it also requires the log level to be DEBUG or TRACE (set either via CODESCENE_LOG_LEVEL or using the Enable detailed traces feature).
Be aware that this can produce a lot of log data and log sensitive information like passwords or API keys so it should be used sparingly and only for a brief period of time.
Logging database queries (MySQL or embedded H2 db)
_This feature doesn’t work for MariaDB._
You can use config variable CODESCENE_LOG_DB_QUERY=true to log all database queries executed by CodeScene to a dedicated log file codescene.db.log (stored in CodeScene’s working directory).
The logging is performed through p6spy library. The format of the log messages is
%(currentTime)|%(executionTime)|%(category)|connection%(connectionId)|%(sqlSingleLine)
A sample log message might look like this
26-08-22 09:14:23:624|0|statement|connection0|select project_id, name, pattern_1, pattern_2 from project_temporal_coupling_filters where project_id = 43
WARNING: codescene.db.log file might grow big quickly - there’s no file size limit and no log rotation in place. If you use this, you need to manage it manually.
PR Integration error when runing CodeScene with docker-compose
While setting up the PR Integration for your project, on rare ocasions CodeScene might fail with exception:
sun.security.validator.ValidatorException: PKIX path building failed:
sun.security.provider.certpath.SunCertPathBuilderException:
unable to find valid certification path to requested target
In most cases, this happens because the certificate provided by the host URL is self-signed or one of the chain certificate is not trusted. The workaround is to create a local trust store and import the host URL certificate and the CA chain following the guide below:
Get the certificate from the host URL:
openssl s_client -showcerts -connect myhost.com:443 < /dev/null | openssl x509 -outform pem > mycertificate.pem
Make a folder to save the store:
mkdir store
Create the keystore (you will be asked to set a password, also answer yes when asked to trust the certificate):
keytool -import -alias mykey -keystore store/mytruststore.ks -file mycertificate.pem
Import the java cacerts. For Mac OSX, the source password is empty (just press enter), the destination password is the one set on step 3; for other operating systems, you should adapt the srckeystore path value.
keytool -importkeystore -srckeystore $(/usr/libexec/java_home)/lib/security/cacerts -destkeystore store/mytruststore.ks
You should now have a truststore in:
store/mytruststore.ks:Edit
docker-compose.ymland addJAVA_OPTIONSand the volume containing the store (replaceyourpasswith the password set in step 3).
environment:
    ...
    - JAVA_OPTIONS=-Djavax.net.ssl.trustStore=/store/mytruststore.ks -Djavax.net.ssl.trustStorePassword=yourpass
    ...
volumes:
    ...
    - ./store:/store
    ...
Advanced diagnostics & profiling
jcmd
jcmd is a diagnostics command-line tool shipped with JDK. It can be used to quickly gather various data (GC metrics, VM info, etc.) about running java application including CodeScene.
To use jcmd with CodeScene running in a Docker container you can leverage jattach utility. It’s pre-installed in our Docker image.
docker exec -i -t $(docker ps | grep 'codescene' | head -n 1 | cut -d ' ' -f1) /bin/bash

jattach $(pgrep java) jcmd help

# e.g. to get heap statistics
jattach $(pgrep java) jcmd GC.heap_info
  Connected to remote JVM
  JVM response code = 0
   garbage-first heap   total 326656K, used 154735K [0x00000000b5800000, 0x0000000100000000)
    region size 1024K, 21 young (21504K), 8 survivors (8192K)
   Metaspace       used 176770K, capacity 179022K, committed 180028K, reserved 1191936K
    class space    used 36902K, capacity 37745K, committed 37832K, reserved 1048576K
Java Flight Recorder (JFR)
JFR is a powerful diagnostics and profiling tool that ships with every modern JDK version (including JDK 8). Continuous JFR profiling is a low-overhead (<1 %) profiling mode that can be enabled in production without worries.
Our Docker image enables JFR profiling by default and stores JFR recordings in the /codescene/diagnostics/jfr-dumps/ directory (look for files names hotspot-pid-**).
The recordings are dumped whenever the app is (gracefully) stopped or when the in-memory recording size reaches the 100 MB threshold.
You can customize the directory where the recordings are stored via
JFR__DUMPS_DIRenv var (notice two underscores after JFR).The old recordings are removed when the used disk spaces goes over the configured limit (1 GB). You can customize the limit via
JFR__MAX_DUMPS_SIZE_IN_MBenv var.
You can also start and dump JFR recordings with jcmd (see the previous section).
The following example shows how to use jcmd & JFR within a docker container:
jattach $(pgrep java) jcmd JFR.check
  Connected to remote JVM
  JVM response code = 0
  Recording 1: name=1 maxsize=100.0MB (running)

jattach $(pgrep java) jcmd JFR.dump
...
  Dumped recording, 8.6 MB written to:

  /codescene/hotspot-pid-32-2021_12_16_09_55_45.jfr
When you have a JFR recording (.jfr file) you can open it and analyze with Java Mission Control (JMC) gui application.
CodeScene upgrade
Troubleshooting a locked database
If you see, after a version upgrade, the following in the log file, then your database is locked:
....
INFO [liquibase.lockservice.StandardLockService] - Waiting for changelog lock....
....
In this case, you need to stop CodeScene (if it is not already stopped) and run the following from the command line:
Install Java (any version >= 8) if not already installed
Download the Apache H2 JDBC driver (1.4.196): h2-1.4.196.jar
Copy the JDBC driver into the same folder as the database file:
codescene.mv.dbIn the same folder, create the file check.sql with content:
select * from DATABASECHANGELOGLOCK;In the same folder, create the file update.sql with content:
update DATABASECHANGELOGLOCK set LOCKED = false, LOCKGRANTED = null, LOCKEDBY = null;Run the check script:
java -cp h2-1.4.196.jar org.h2.tools.RunScript -url jdbc:h2:./codescene -user sa -showResults -script check.sql
If the output is not
select * from DATABASECHANGELOGLOCK;
--> 1 FALSE null null
Then run the update script
java -cp h2-1.4.196.jar org.h2.tools.RunScript -url jdbc:h2:./codescene -user sa -showResults -script update.sql
You might want to run the check again to verify that update was executed.