CodeScene’s Dashboards: The Status of Your Codebase at a Glance
CodeScene comes with several dashboards, each one serving a specific use case. In this guide we introduce the dashboard for an analysis, the inter-product dashboard, as well as the system health dashboard.
The Analysis Dashboard Presents the main KPIs
Each analysis project gets its own dashboard where you see the high level results of each analysis.
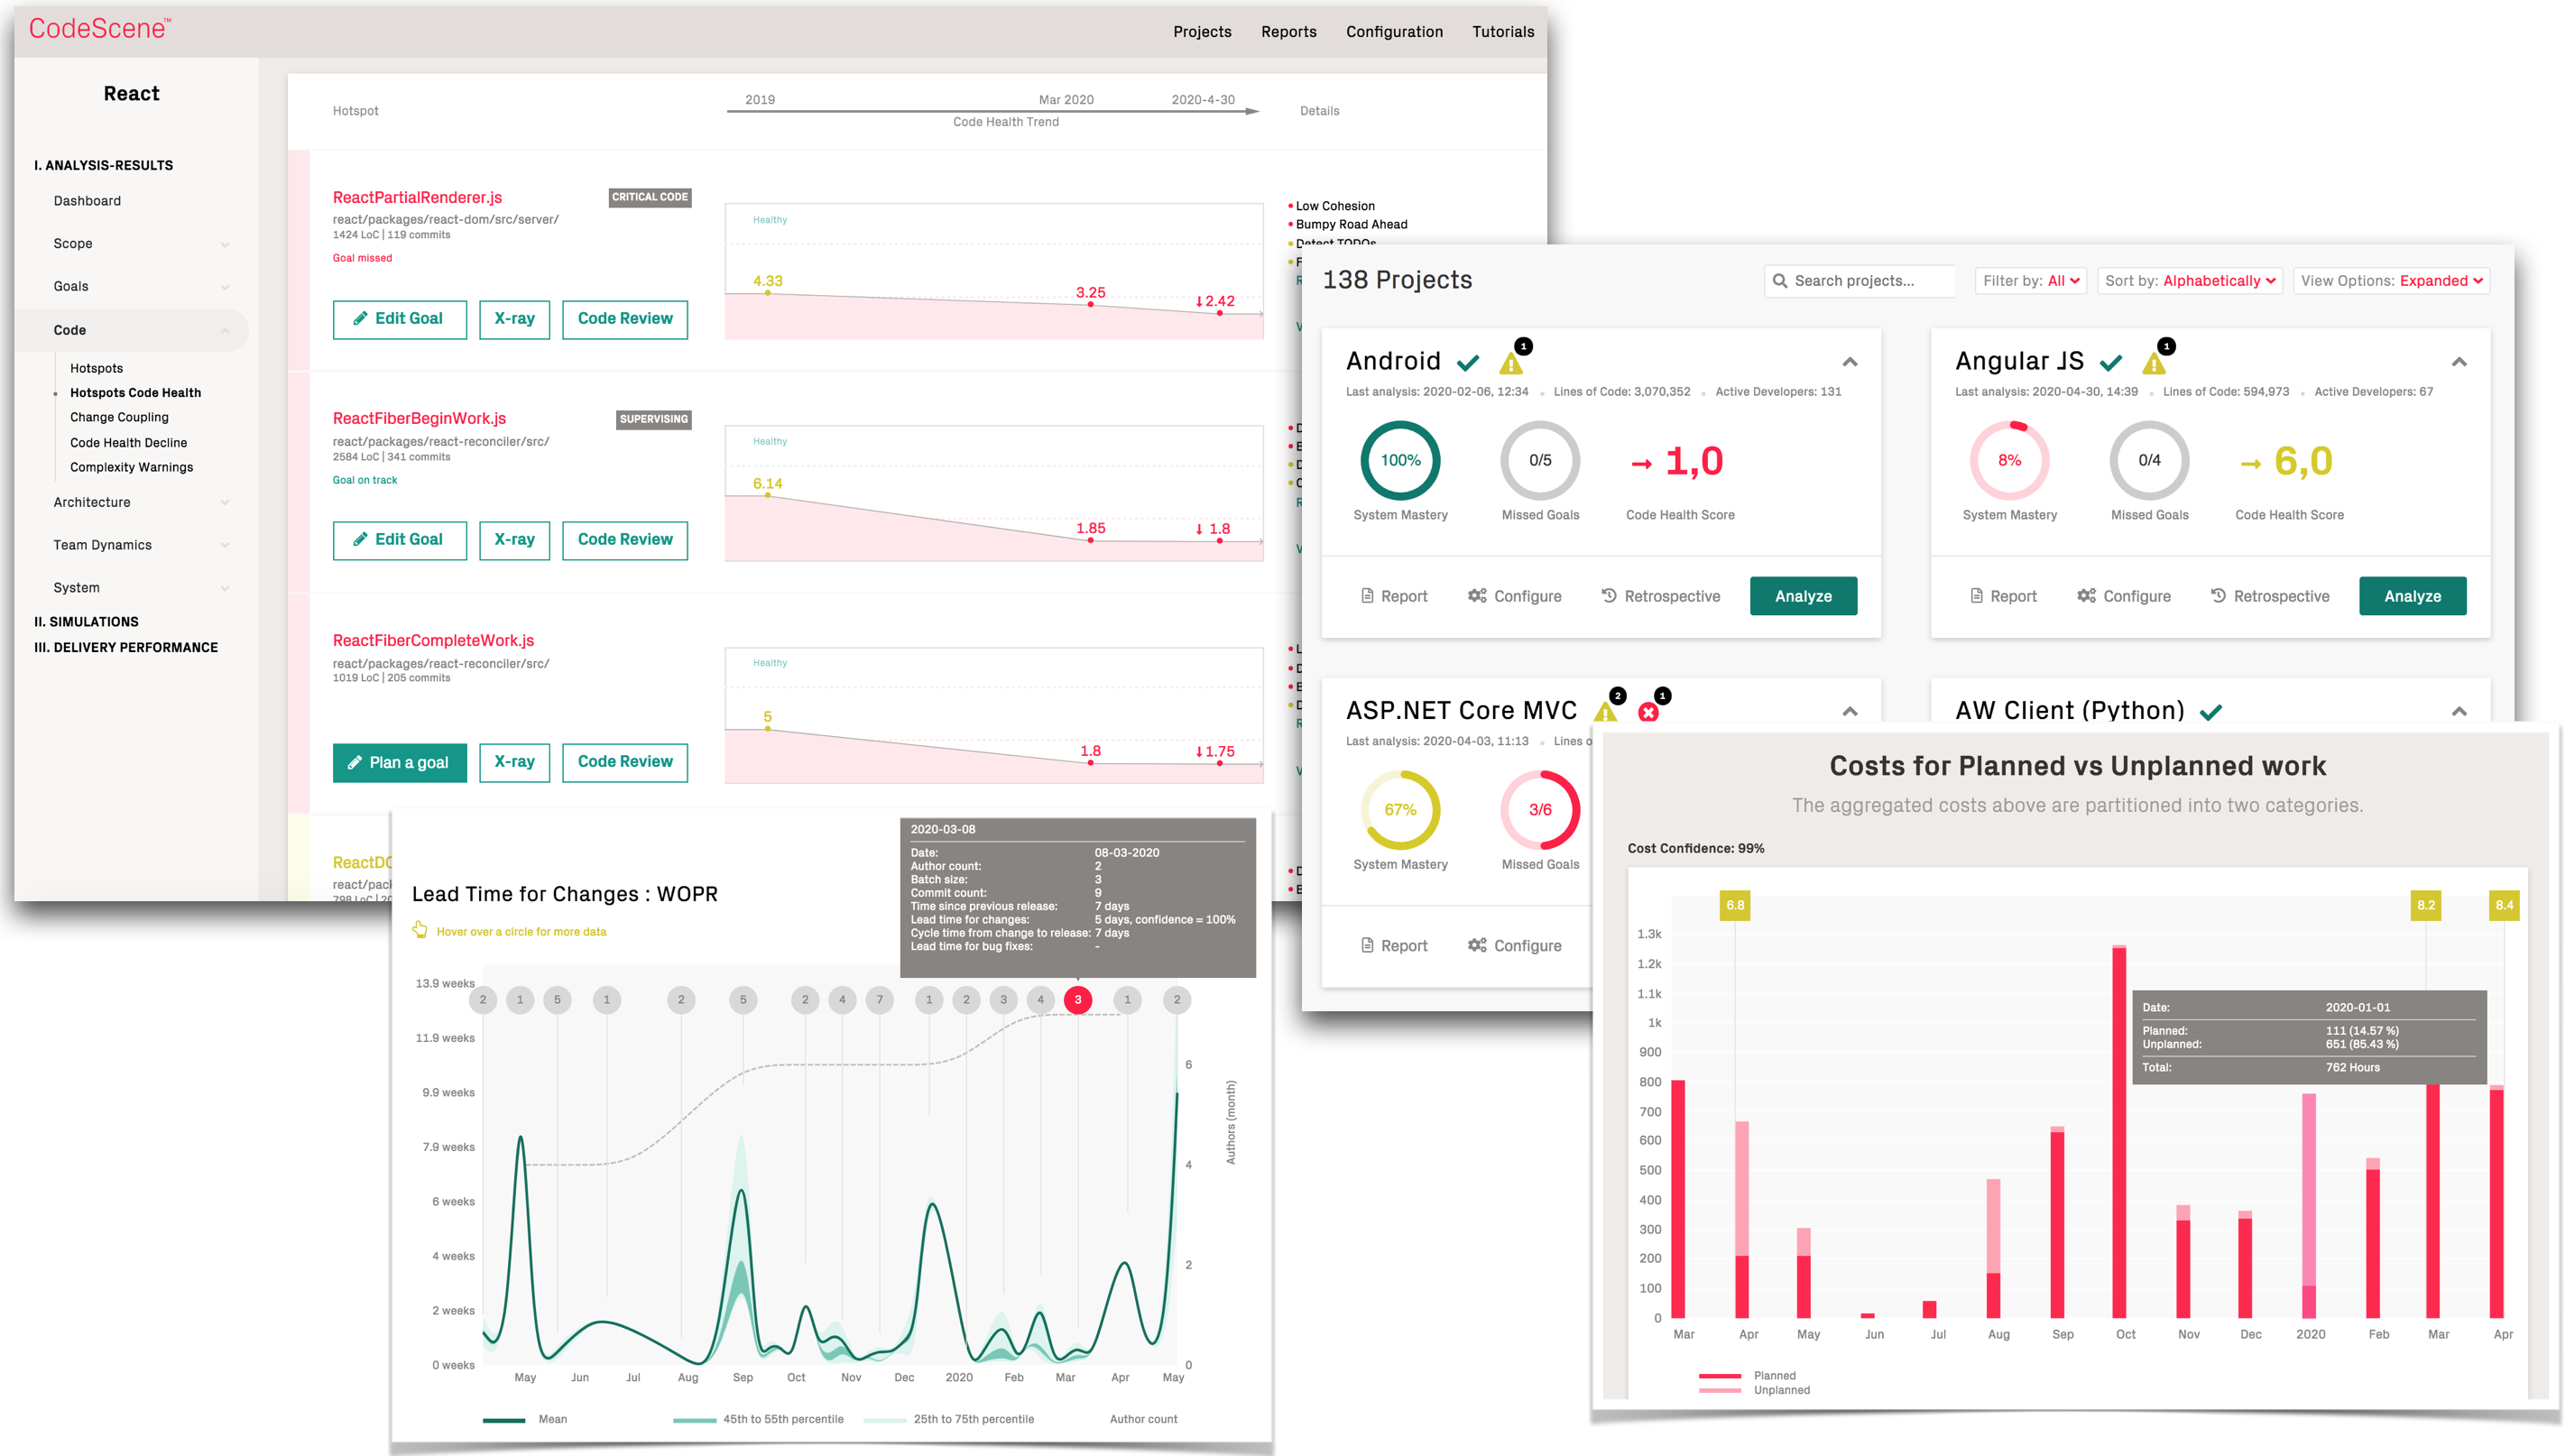
Fig. 72 CodeScene’s interactive analysis dashboard presents the key metrics at a glance.
The dashboard presents the following information:
File Level Hotspots present the system-wide hotspots on a file level.
System Level Hotspots present hotspots on an architectural level. The hotspots are sorted according to the development activity in each component/sub-system/service.
Alerts: CodeScene auto-detects potential problems and present them here in a prioritized order. Click on one of the warnings to get more details and act on the findings.
Key Personnel: Detects key personnel exposure where a significant part of the code is developed by just a few core developers. Follow-up this finding by investigating the knowledge distribution in CodeScene.
Code Health simply shows that trend over the past month and year. A decline in Code Health is a sign that the switch has to be changed from adding new features towards improving the code in the top hotspots.
Interactive Hotspots Map let you explore your whole codebase and identify technical debt.
Branch Delivery Risk shows you the predicted delivery risk and, when clicked on, detailed statistics of active branches. Use this to focus extra testing to where it’s likely to be needed the most.
Development Costs are calculated based on data from Project Management tools like Jira, Trello, Azure DevOps, or GitHub Issues.
PR Statistics tracks the impact of Pull Requests on Code Health over time as described in Integrate CodeScene in your CI/CD Pipeline
The Inter-Project Dashboard gives an Overview of all your Codebases
CodeScene also presents an inter-project dashboard that gives you a high-level overview of all your products, as shown in Fig. 73.
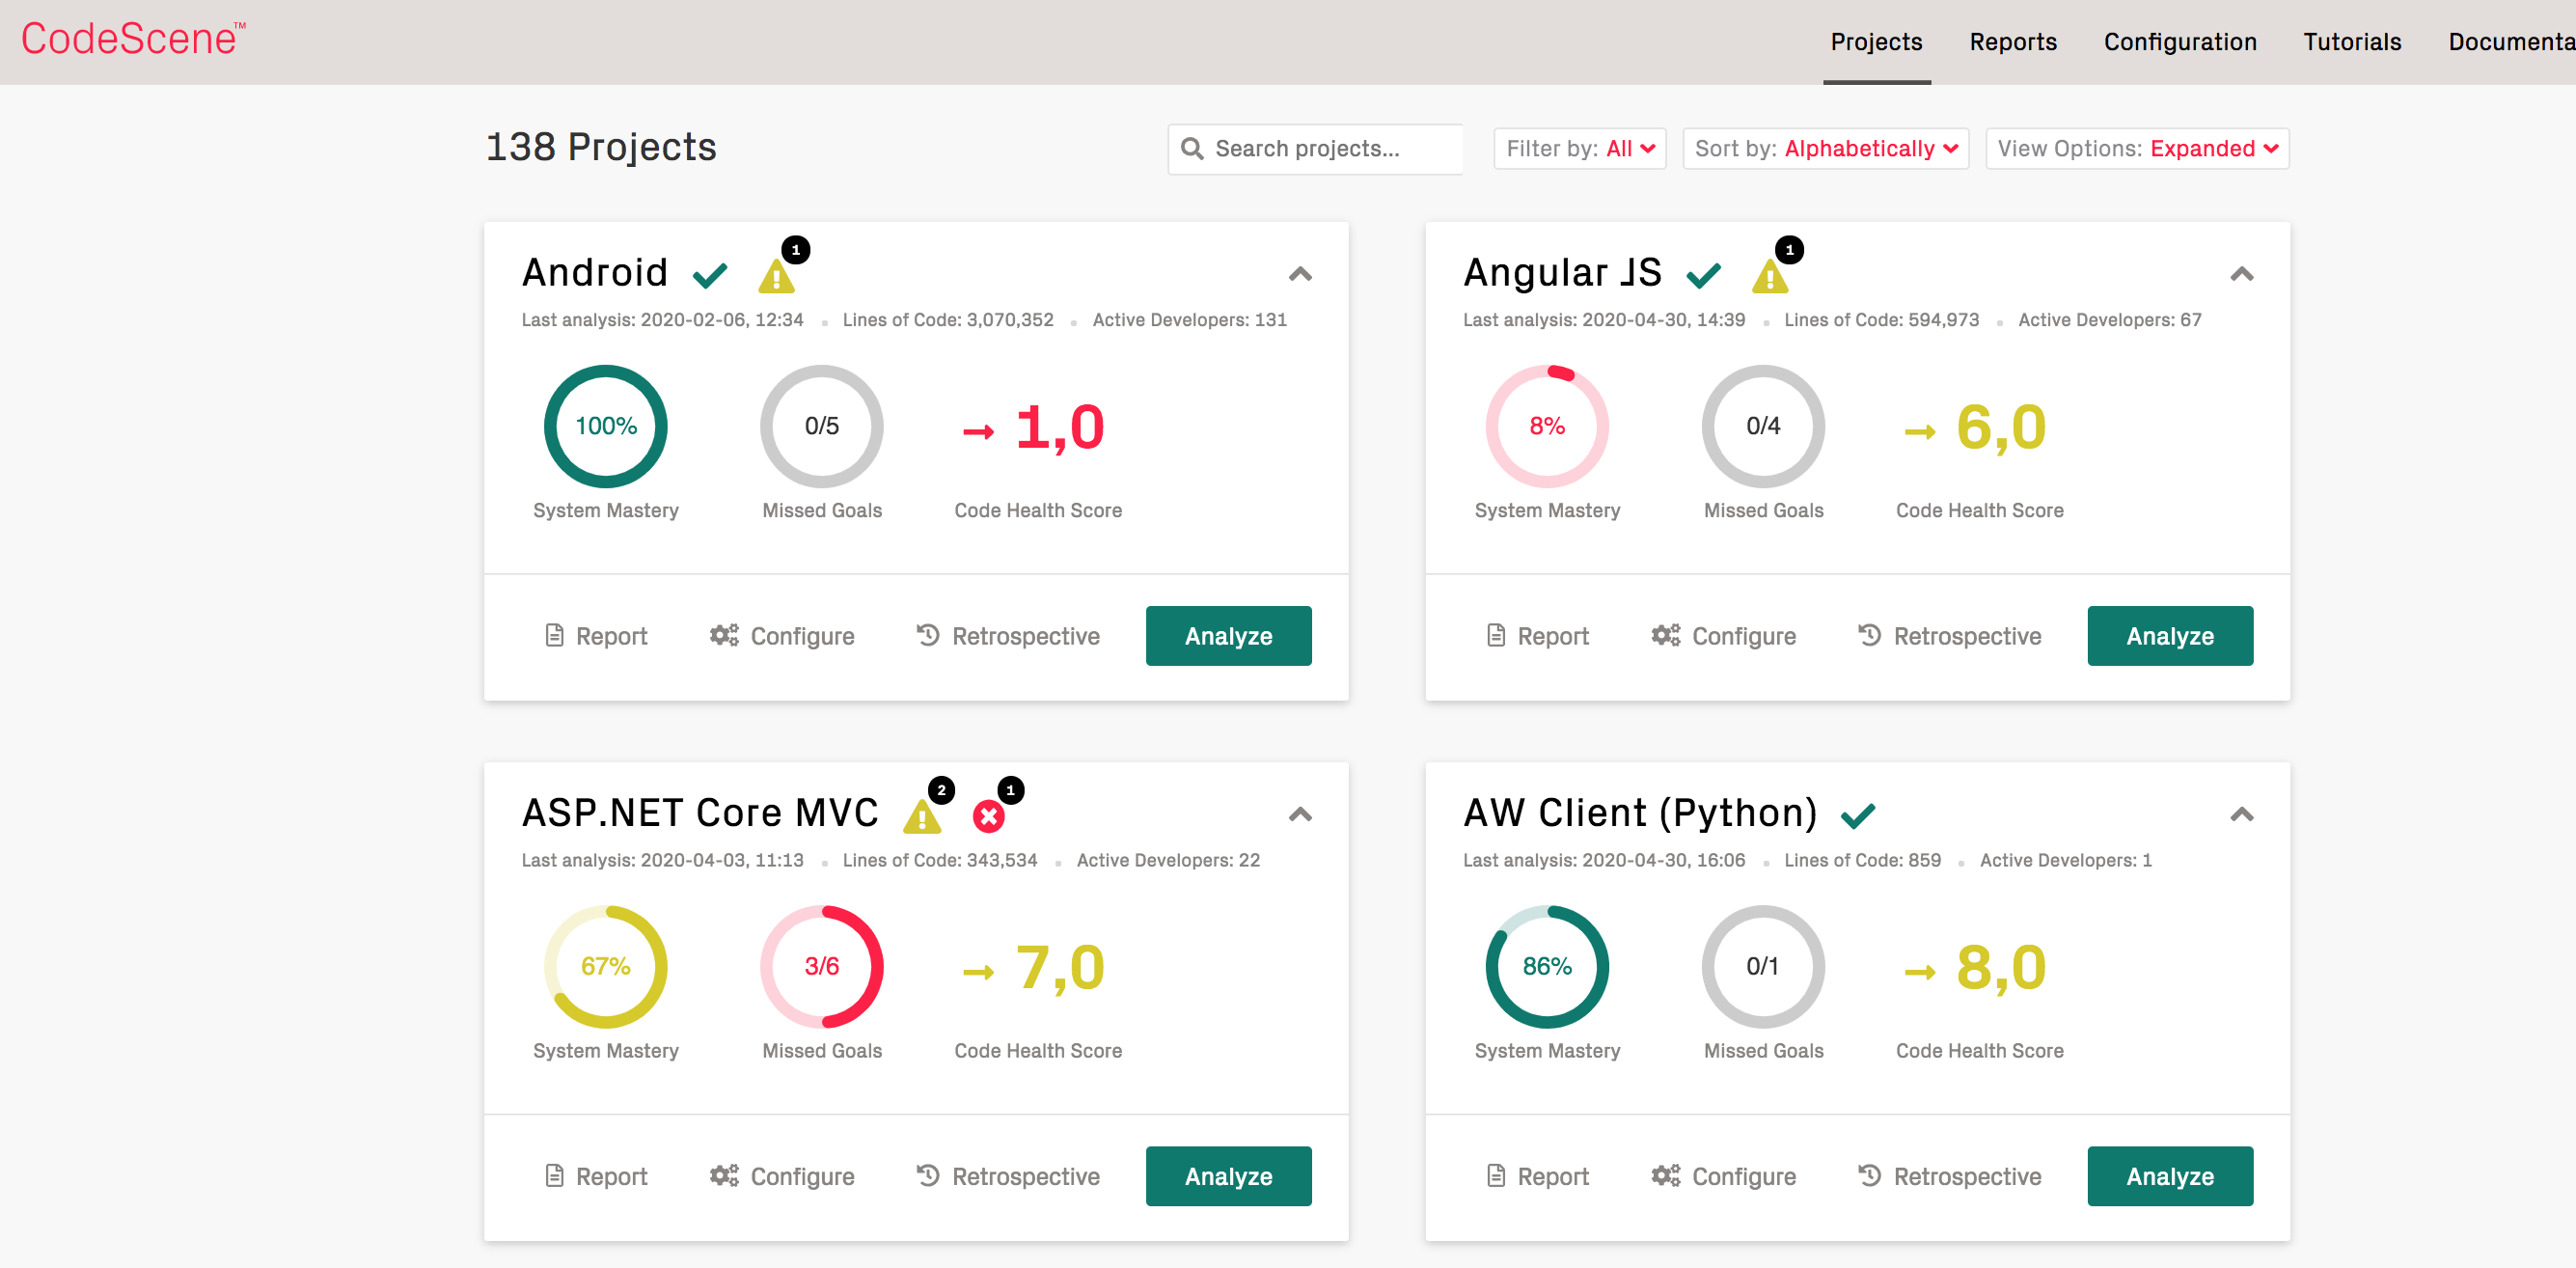
Fig. 73 The high-level dashboard shows that status of all your products at a glance.
Using these key metrics on the dashboard, in particular the progress on the goals, point you the products/codebase that you need to inspect in more depth.
Finally, note that you can restrict access to certain analysis projects as described in Users and Roles.