Track Analysis Progress
CodeScene presents a progress bar on running analyses. The progress bar is based on how long the previous analysis of the same project took:
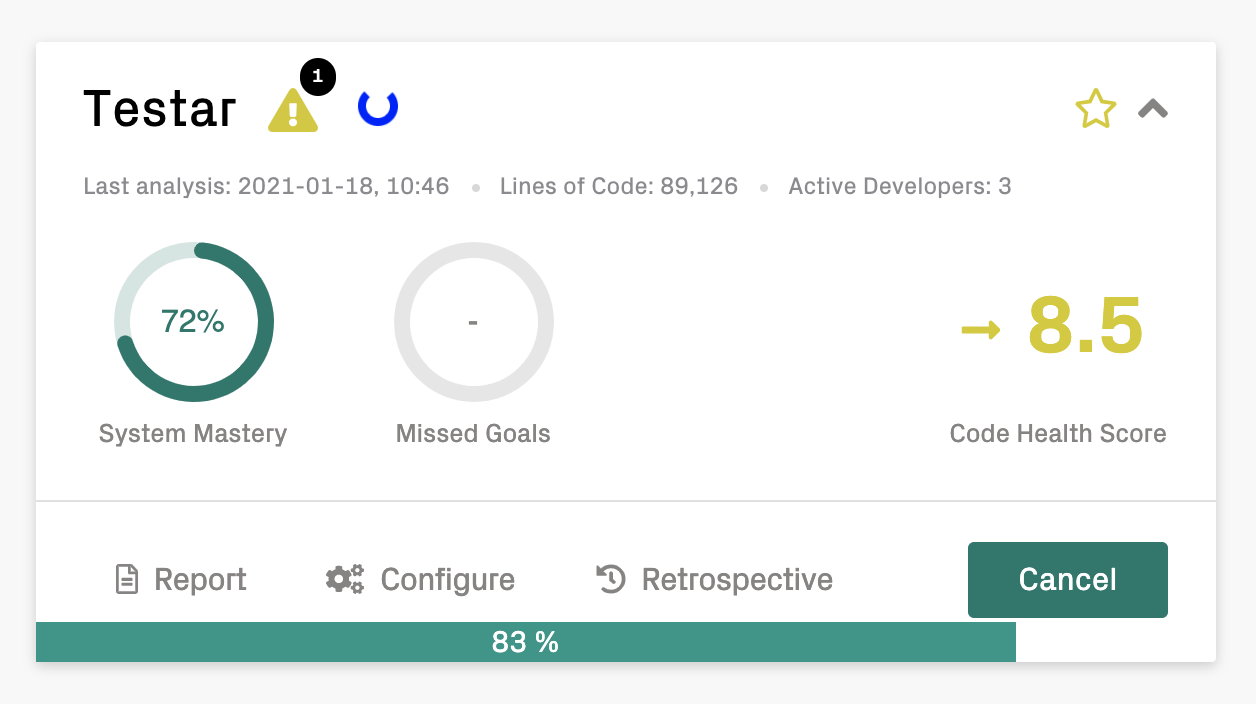
Fig. 18 The progress bar shows the estimated time to complete the analysis.
The progress bar also lets you detect stale analyses that might hang (a rare case). The rules for the progress bar are:
At 120% of the previous analysis time, the progress bar turns yellow.
At 200% of the previous analysis time (twice as long), the progress bar turns red.
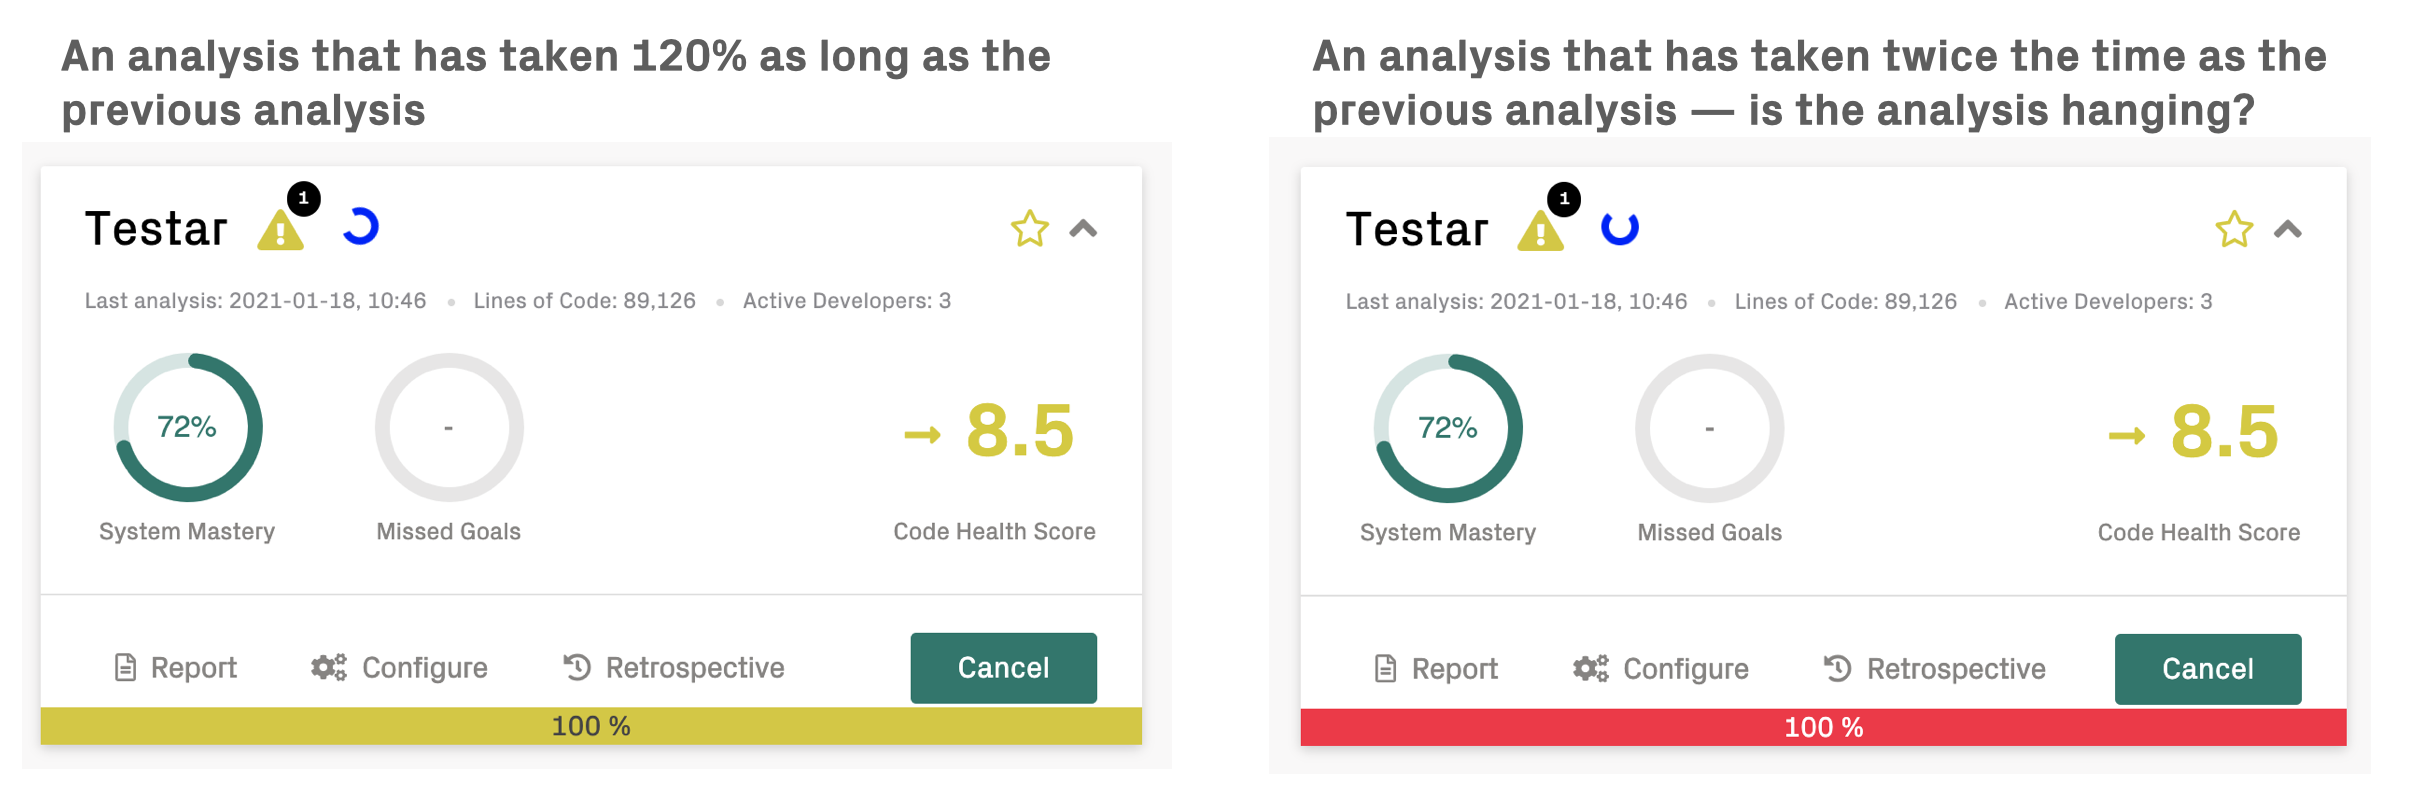
Fig. 19 Detect analyses that appear to hang or take longer than expected.
Note that project configuration changes might increase the analysis time. For example, defining architectural components, enabling the Jira integration, or enabling the Full Code Health Scan will significantly prolong the analysis time. After the first analysis has completed with changed settings, future progress reporting will be re-calibrated and reliable.
Future Directions
We plan to add an alert system that informs administrators about potentially hanging analyses via Slack and email.