CodeScene’s Plugin System: integrate static analysis tools and code coverage metrics
The CodeScene platform covers a broad range of software analyses, including technical and organizational aspects. CodeScene’s plugin system lets you augment that information by integrate third party information in the CodeScene analysis views. This lets you get a holistic picture of your codebase in one place.
The goal for the CodeScene team is to open up the plugin API and let the community – and you – provide custom plugins. That means you could integrate any kind of information in the analysis views, for example performance profiling, security scan audits, or any proprietary data you use for decisions today.
In the short term, the CodeScene team is developing plugins for the most frequently requested integrations:
SonarQube and SonarCloud: Integrate static code analysis results into CodeScene’s views. Prioritize static analysis results via CodeScene’s hotspots and virtual code review, or integrate security specific findings in the hotspot views.
Code Coverage: Visualize the test coverage of your application code. This lets you detect areas that lack tests as well as make sure the top hotspots have adequate coverage.
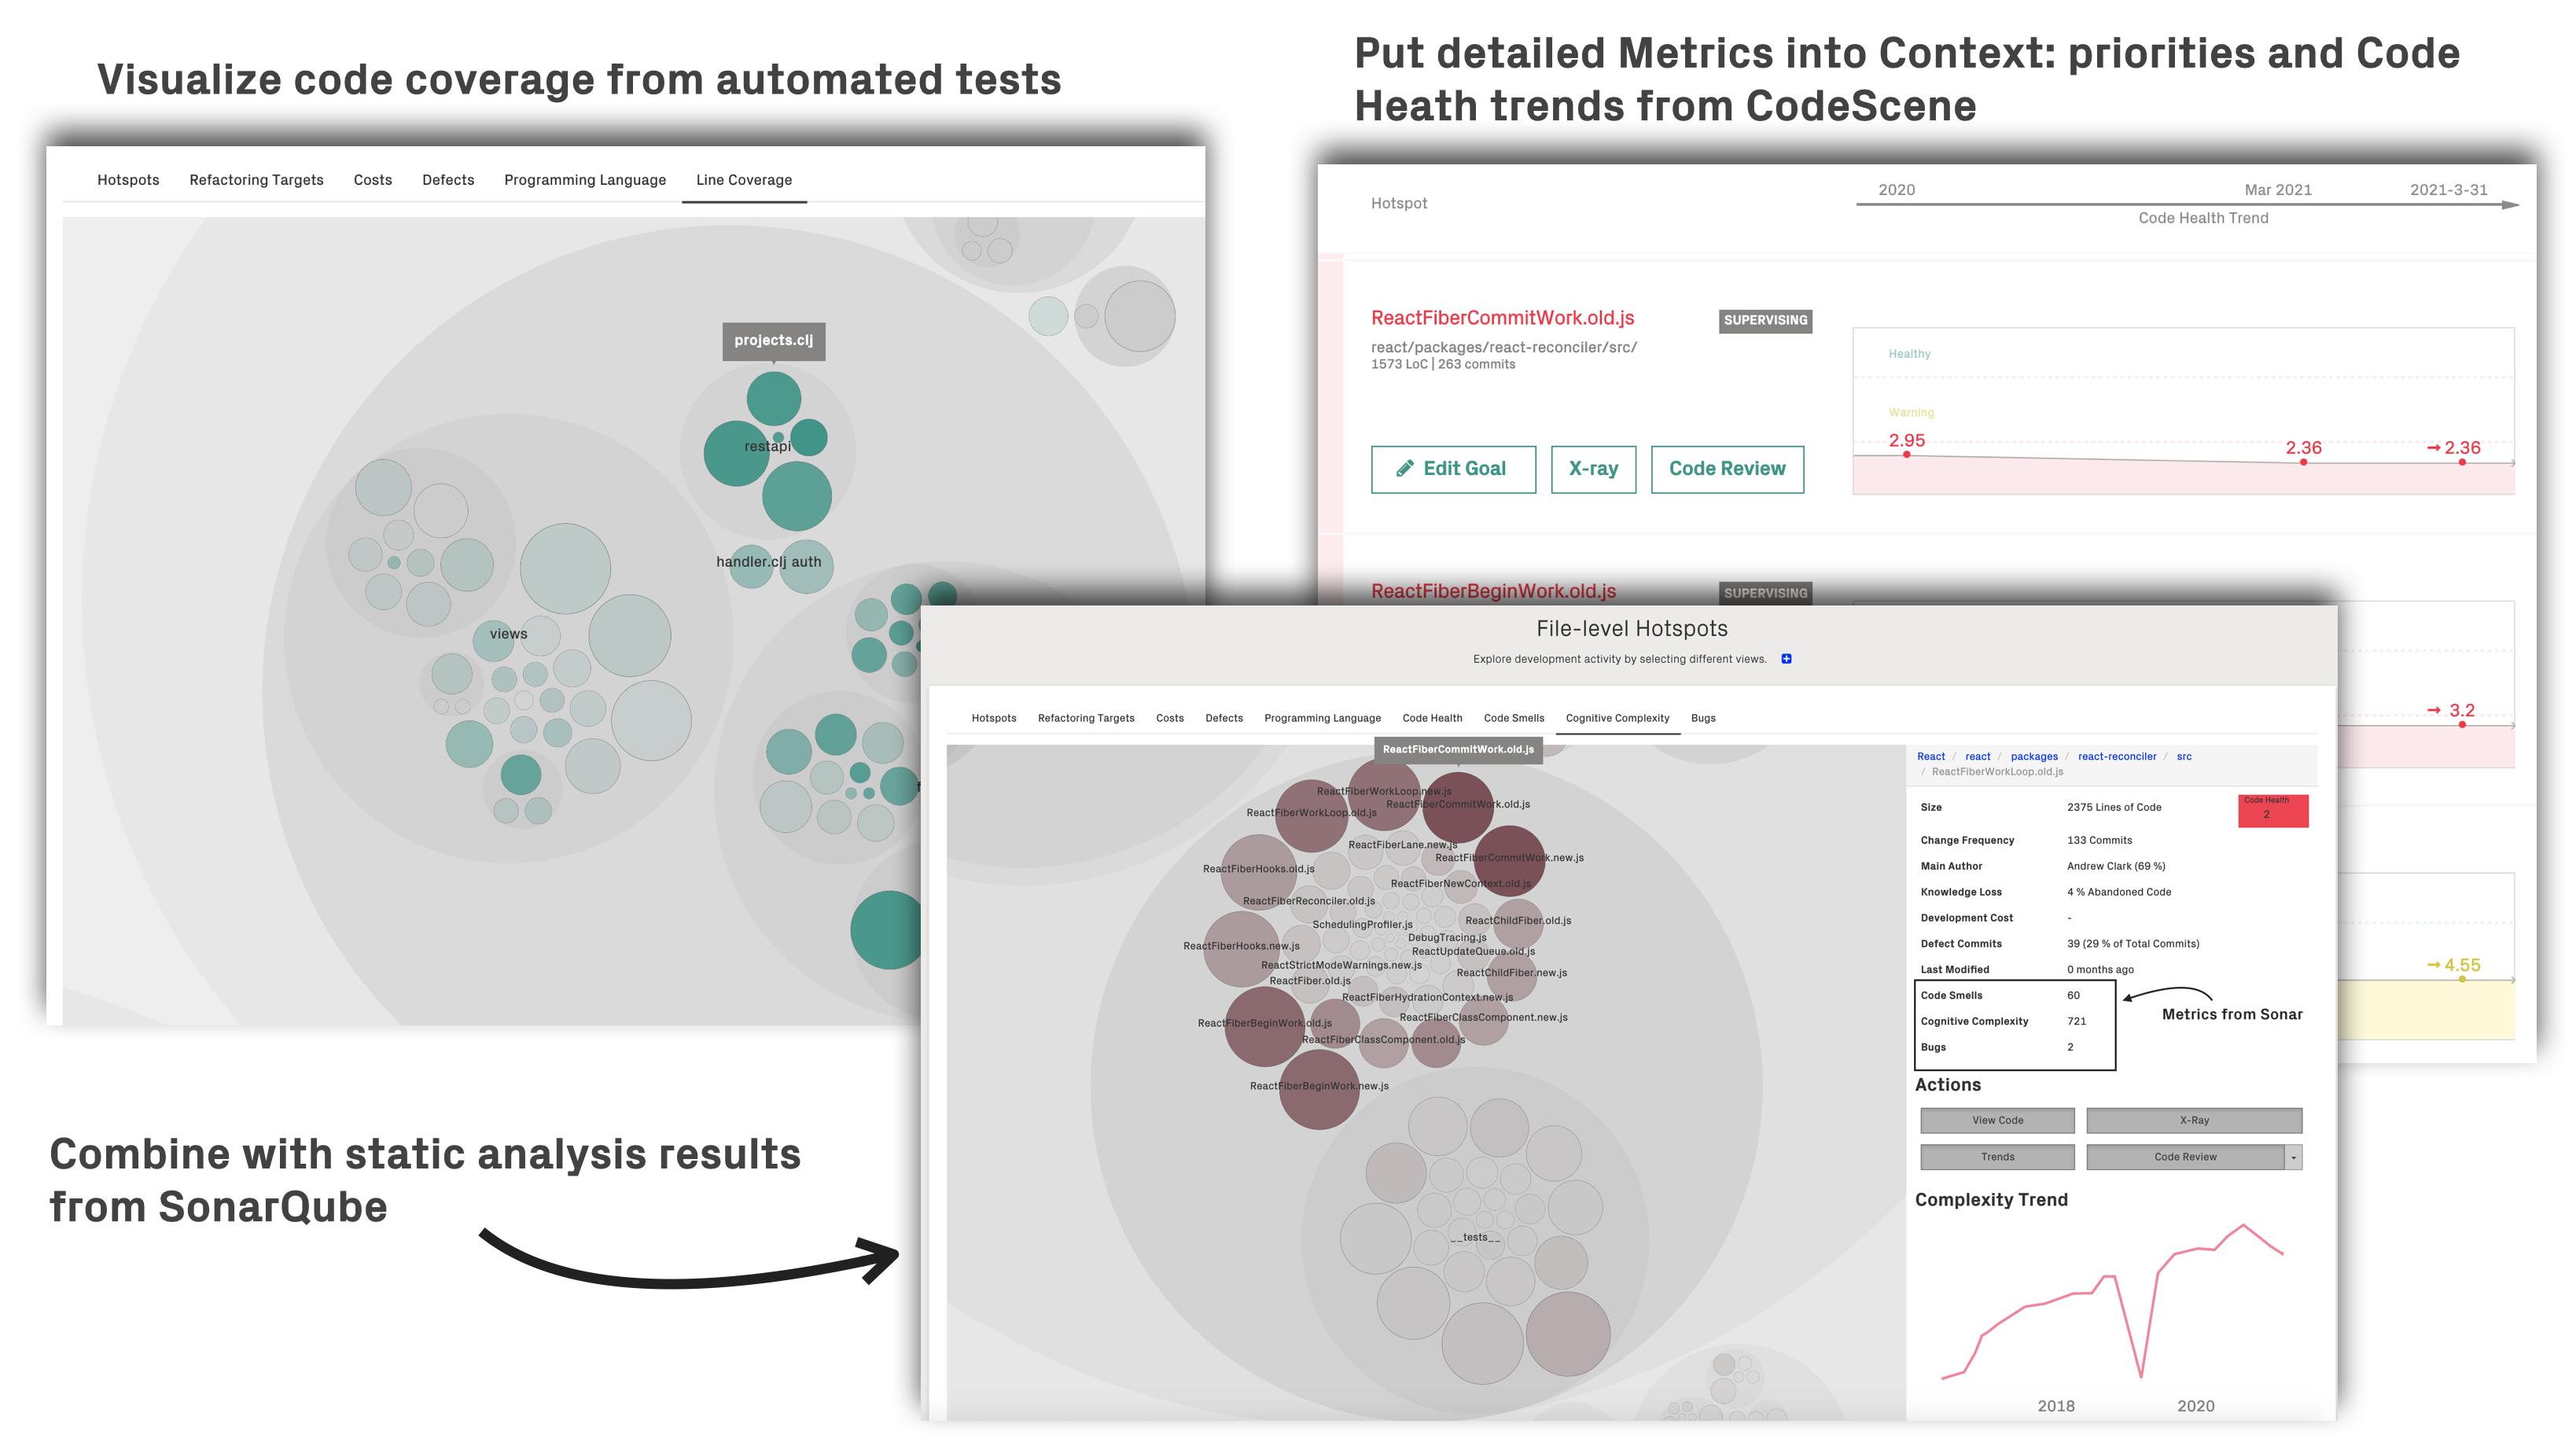
Fig. 45 CodeScene’s plugins let you integrate other data sources to get a holistic overview of your codebase.
These plugins are available for you automatically. This document explains how to configure them as well as capturing the main uses cases.
The main advantage of the integration is that CodeScene a) aggregates data from multiple sources, b) puts the metrics into context via CodeScene prioritized hotspots, and c) visualizes large data sets which makes the data actionable.
Integrate SonarQube as a CodeScene plugin
Motivation: There is an overlap between CodeScene’s technical metrics (e.g. code health and virtual code review) and static analysis. The code health metrics are more at the design level while static analysis can be a complement as a low-level feedback loop during development. At the system level, static analysis is often verbose. Via CodeScene’s SonarQube plugin, all static analysis details are put into the context of CodeScene’s prioritized hotspots. The combination gives you the best of two worlds and help making the static analysis results actionable through the lens of prioritized hotspots.
SonarQube is a static analysis tool. The main differences compared to CodeScene are:
Static analysis works on a snapshot of the codebase while CodeScene considers the temporal dimension and evolution of the whole system.
CodeScene priorities based on the likely business and delivery impact, not just what’s visible in the code.
CodeScene measures organizational factors like key personnel risks and team coordination. These factors increase in importance with the size of the organization.
CodeScene focuses on the maintainability, readability, and sustainability of the development, while Sonar provides detailed code-level findings.
As such, static analysis is often a good complement to CodeScene.
CodeScene integrates the Sonar data into the Interactive Maps and Code Review
CodeScene’s Sonar plugin integrates any SonarQube data into the interactive hotspot map as well as in the virtual code review:
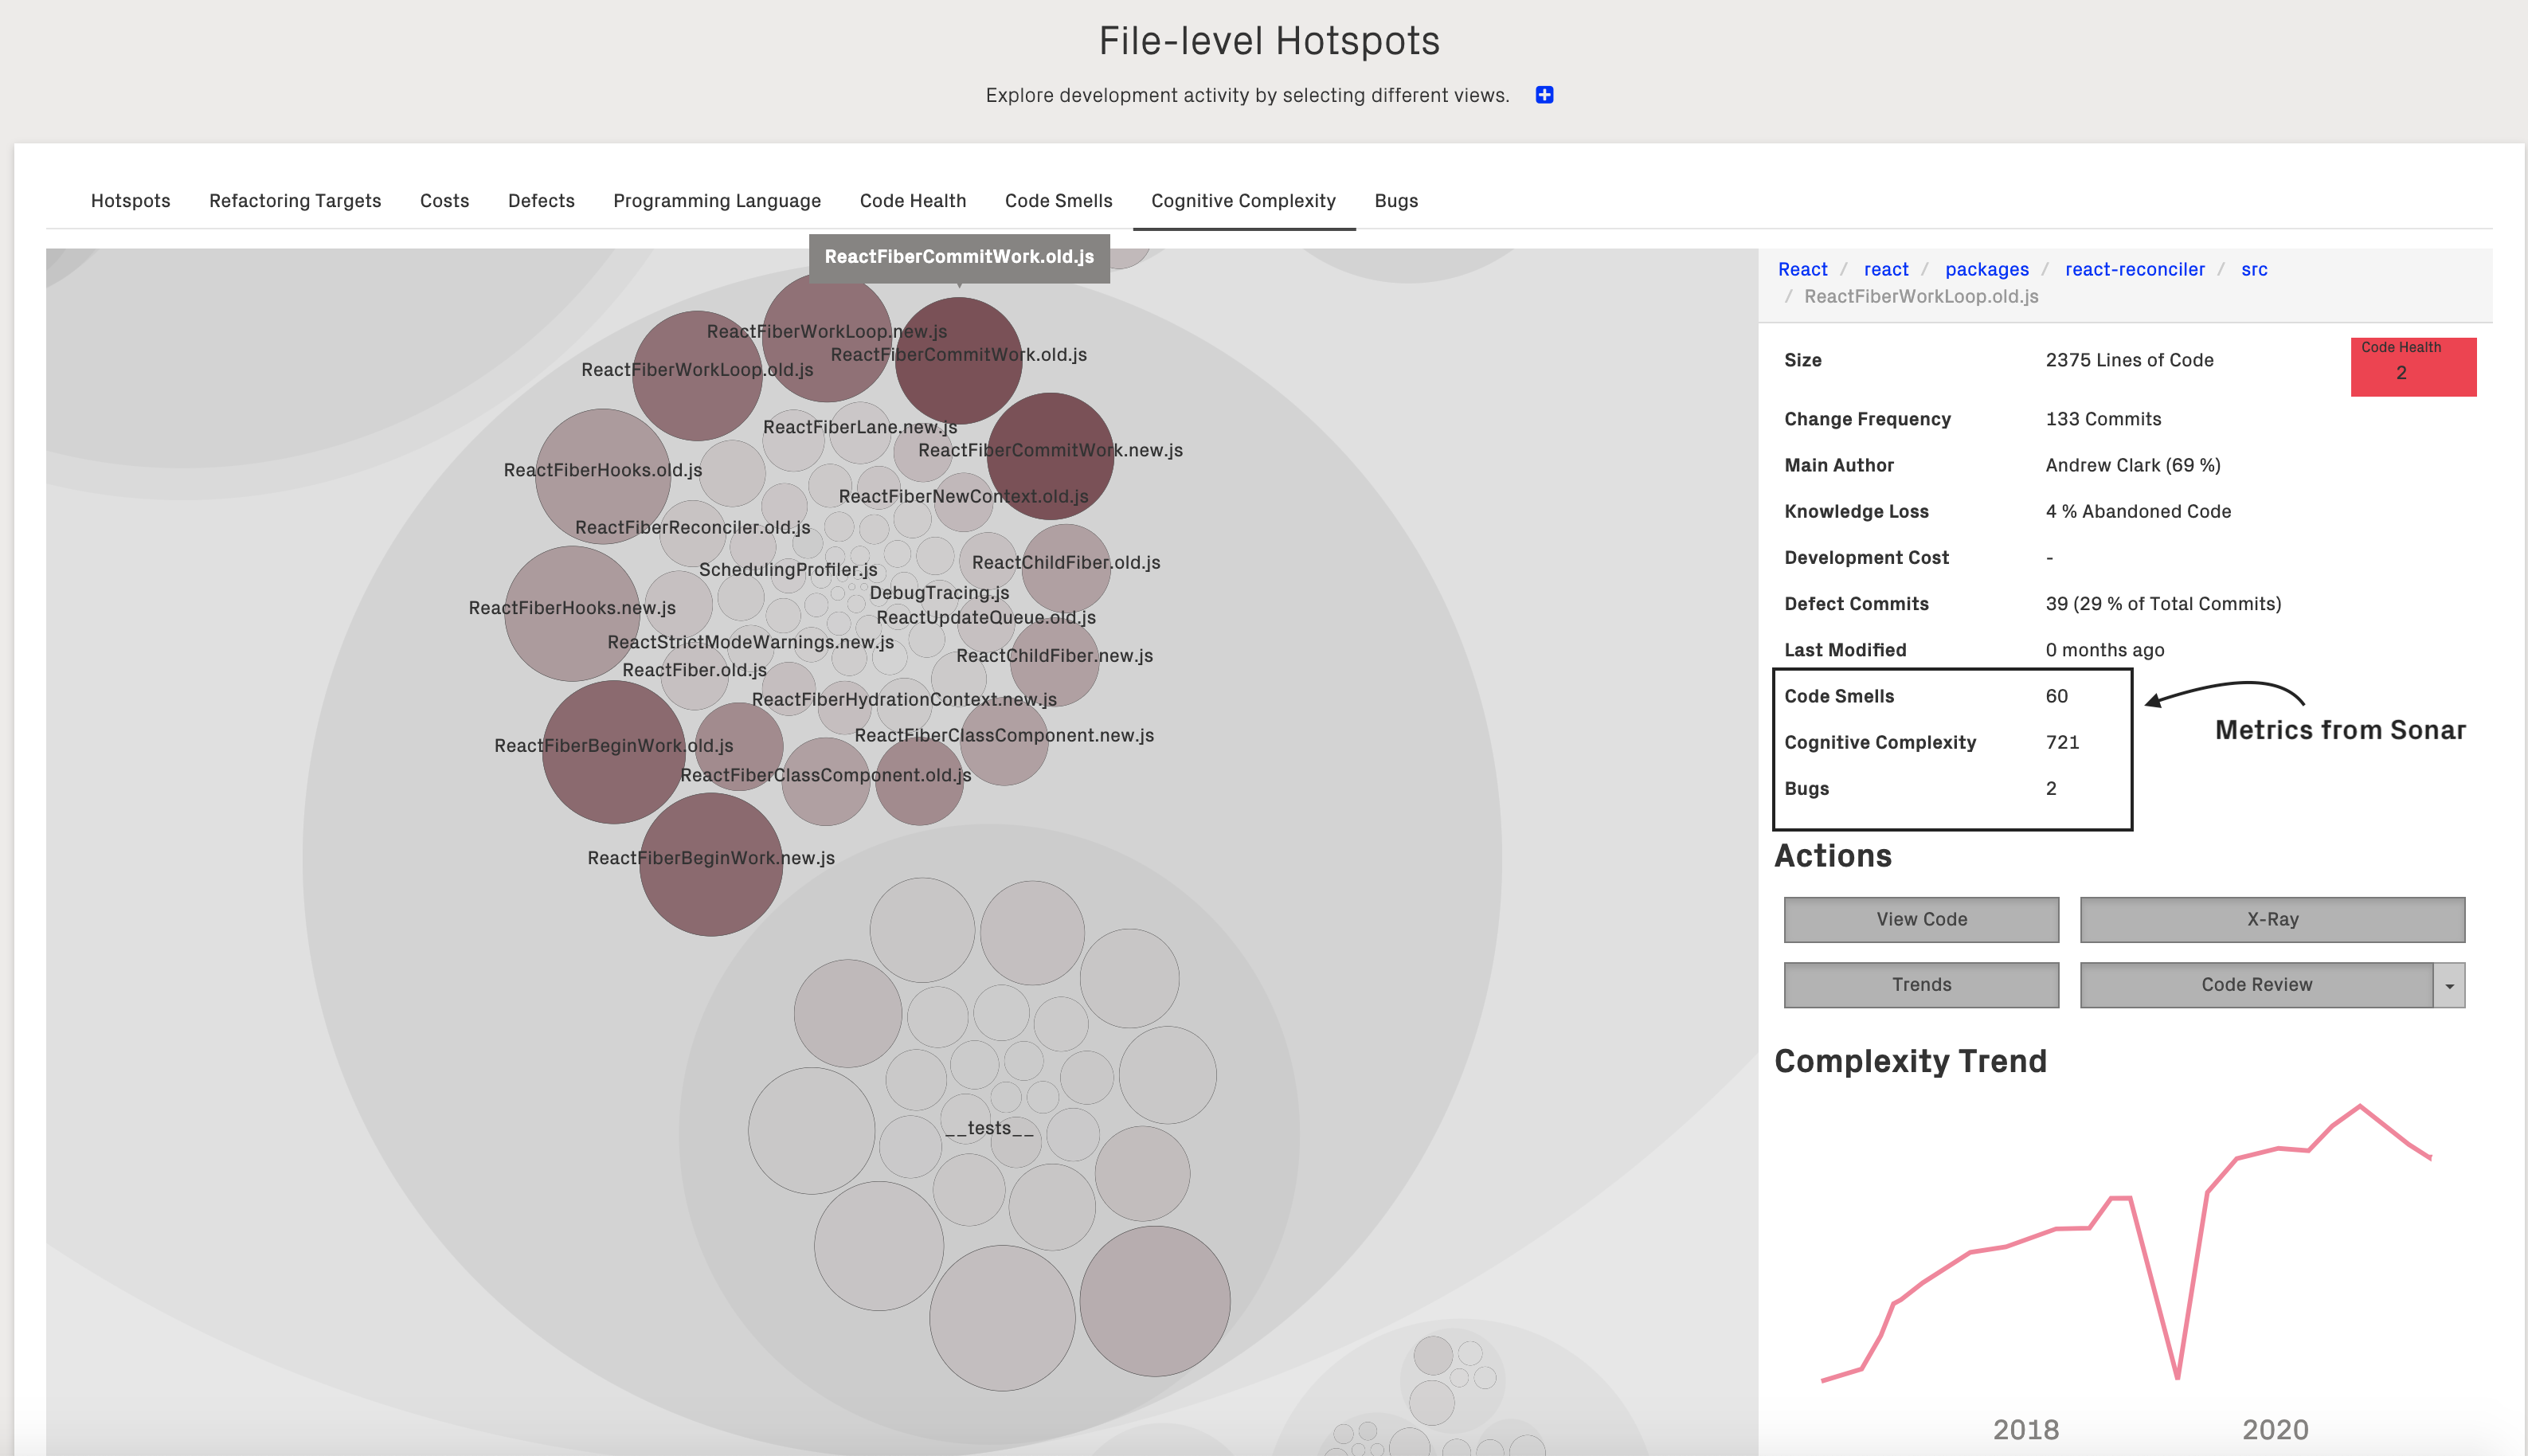
Fig. 46 CodeScene integrates SonarQube metrics in its interactive views. Here’s an example of visualizing Cognitive Complexity.
CodeScene lets you extract any metrics from Sonar. You specify the metrics of interest in your CodeScene project:
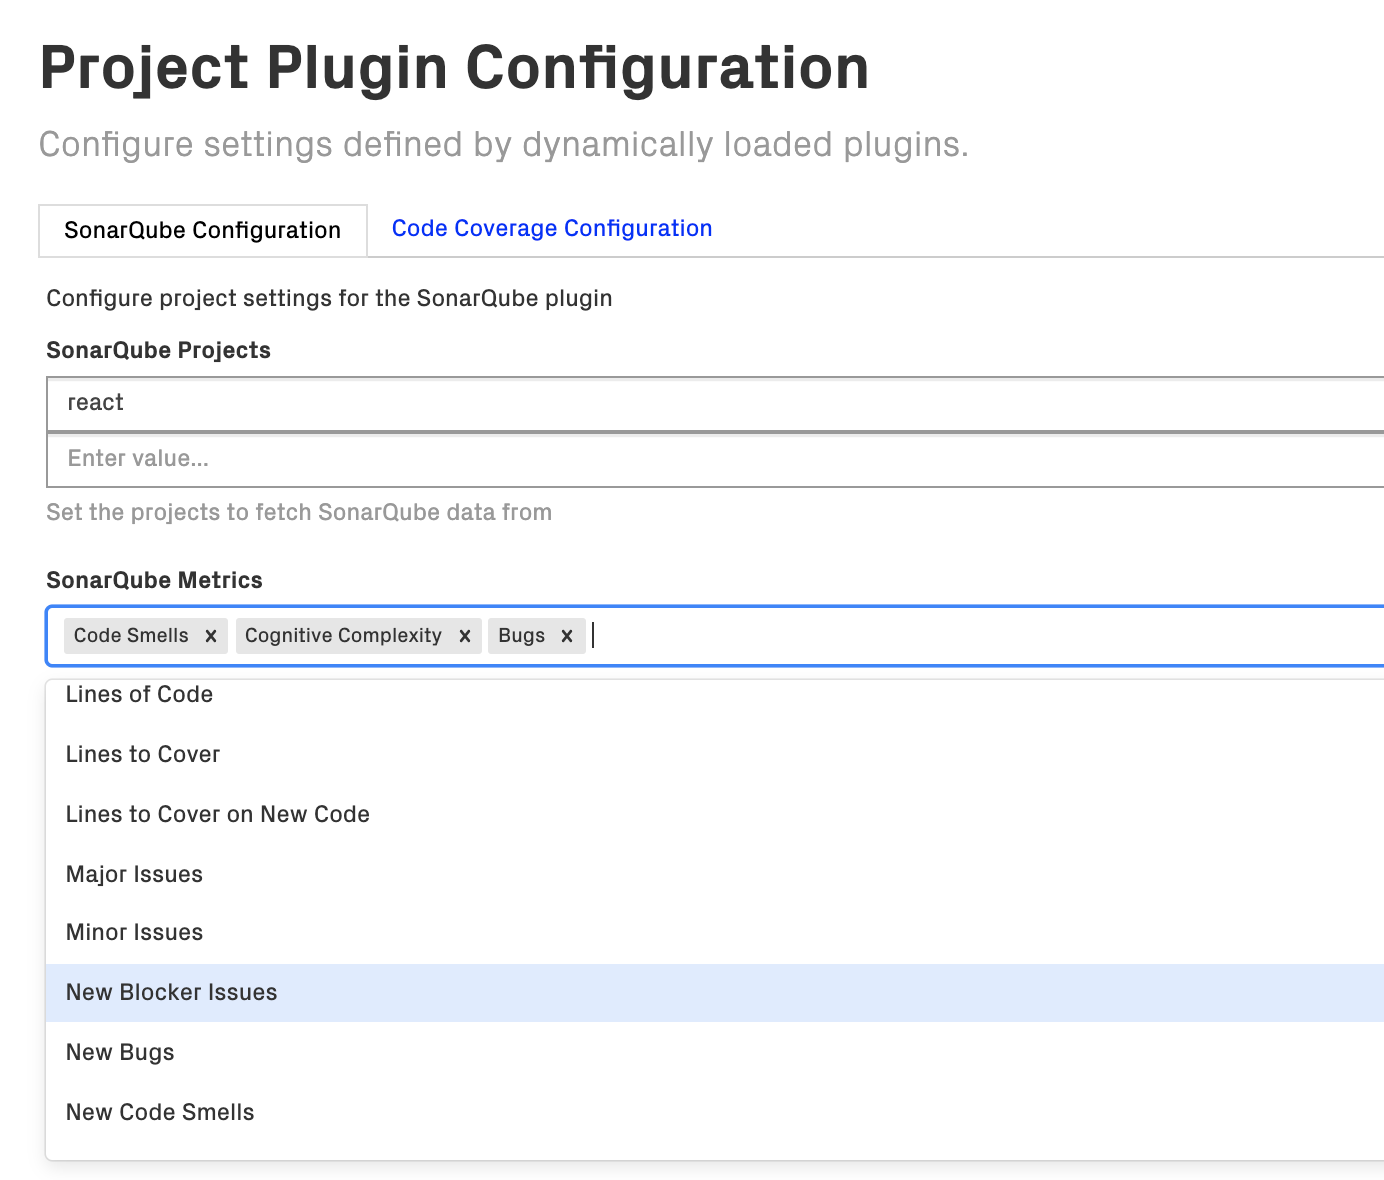
Fig. 47 Configure the Sonar metrics of interest. Each metric gets its own perspective in CodeScene’s interactive map.
You can specify any number of metrics, and each one of them will get its own perspective inside CodeScene’s hotspot map.
CodeScene also augments its virtual code review with a summary of the Sonar findings. Clicking on the “Read More” link takes you to the detailed Sonar data:
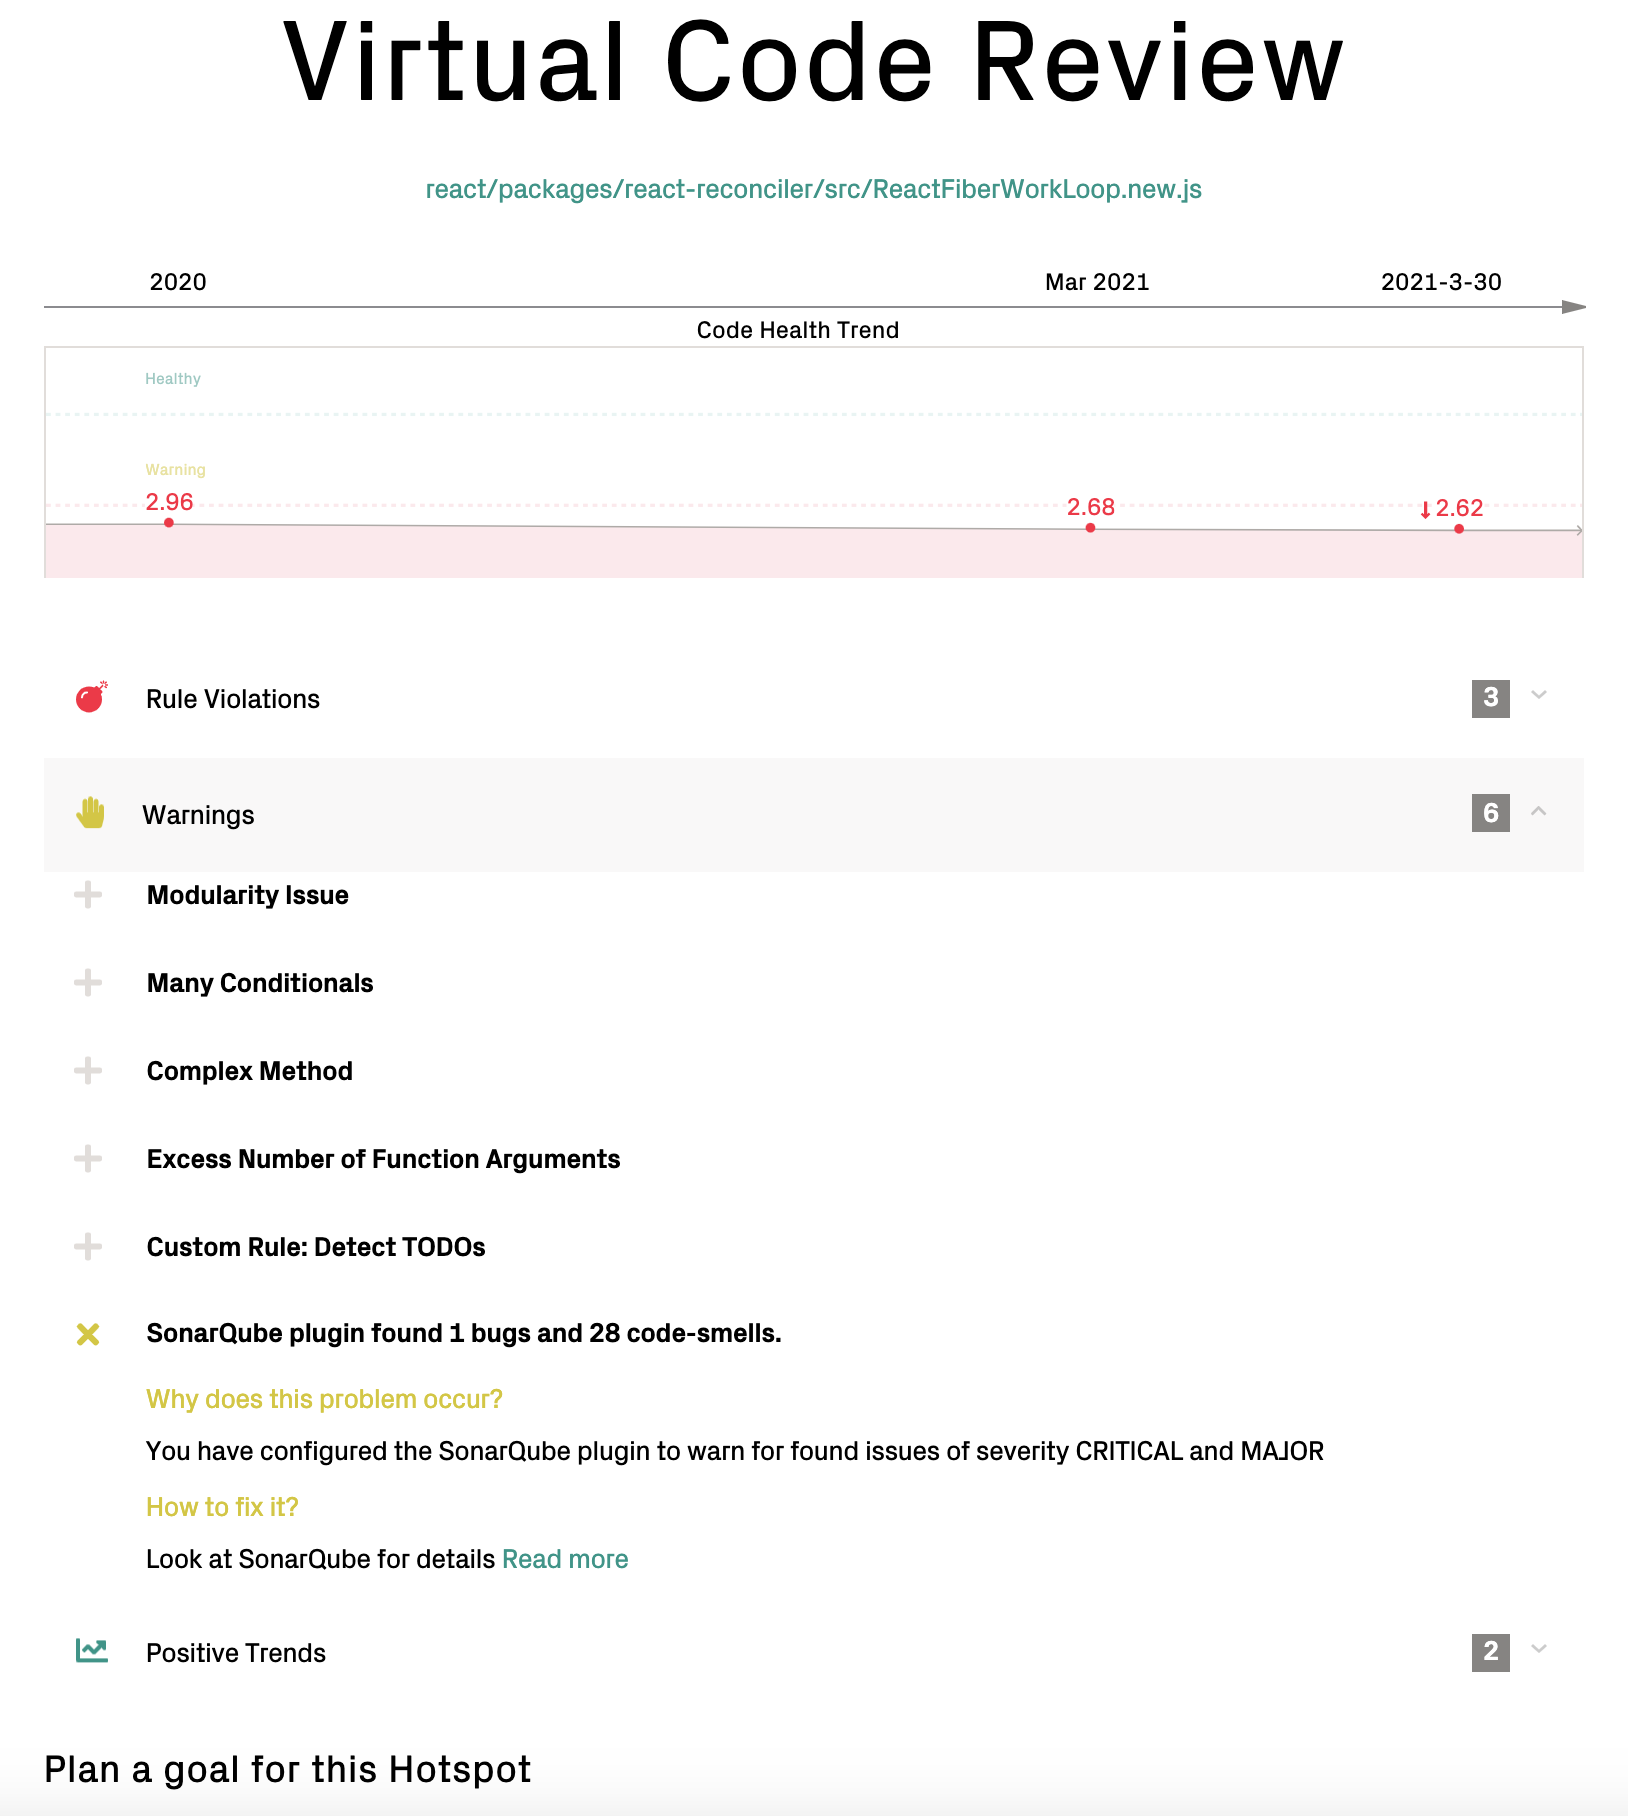
Fig. 48 CodeScene aggregates the Sonar findings per file in its virtual code review.
Configure the SonarQube Plugin
The SonarQube plugin needs credentials that let CodeScene access the Sonar instance. You specify these credentials once in the global setting so that they can be reused for all CodeScene projects:
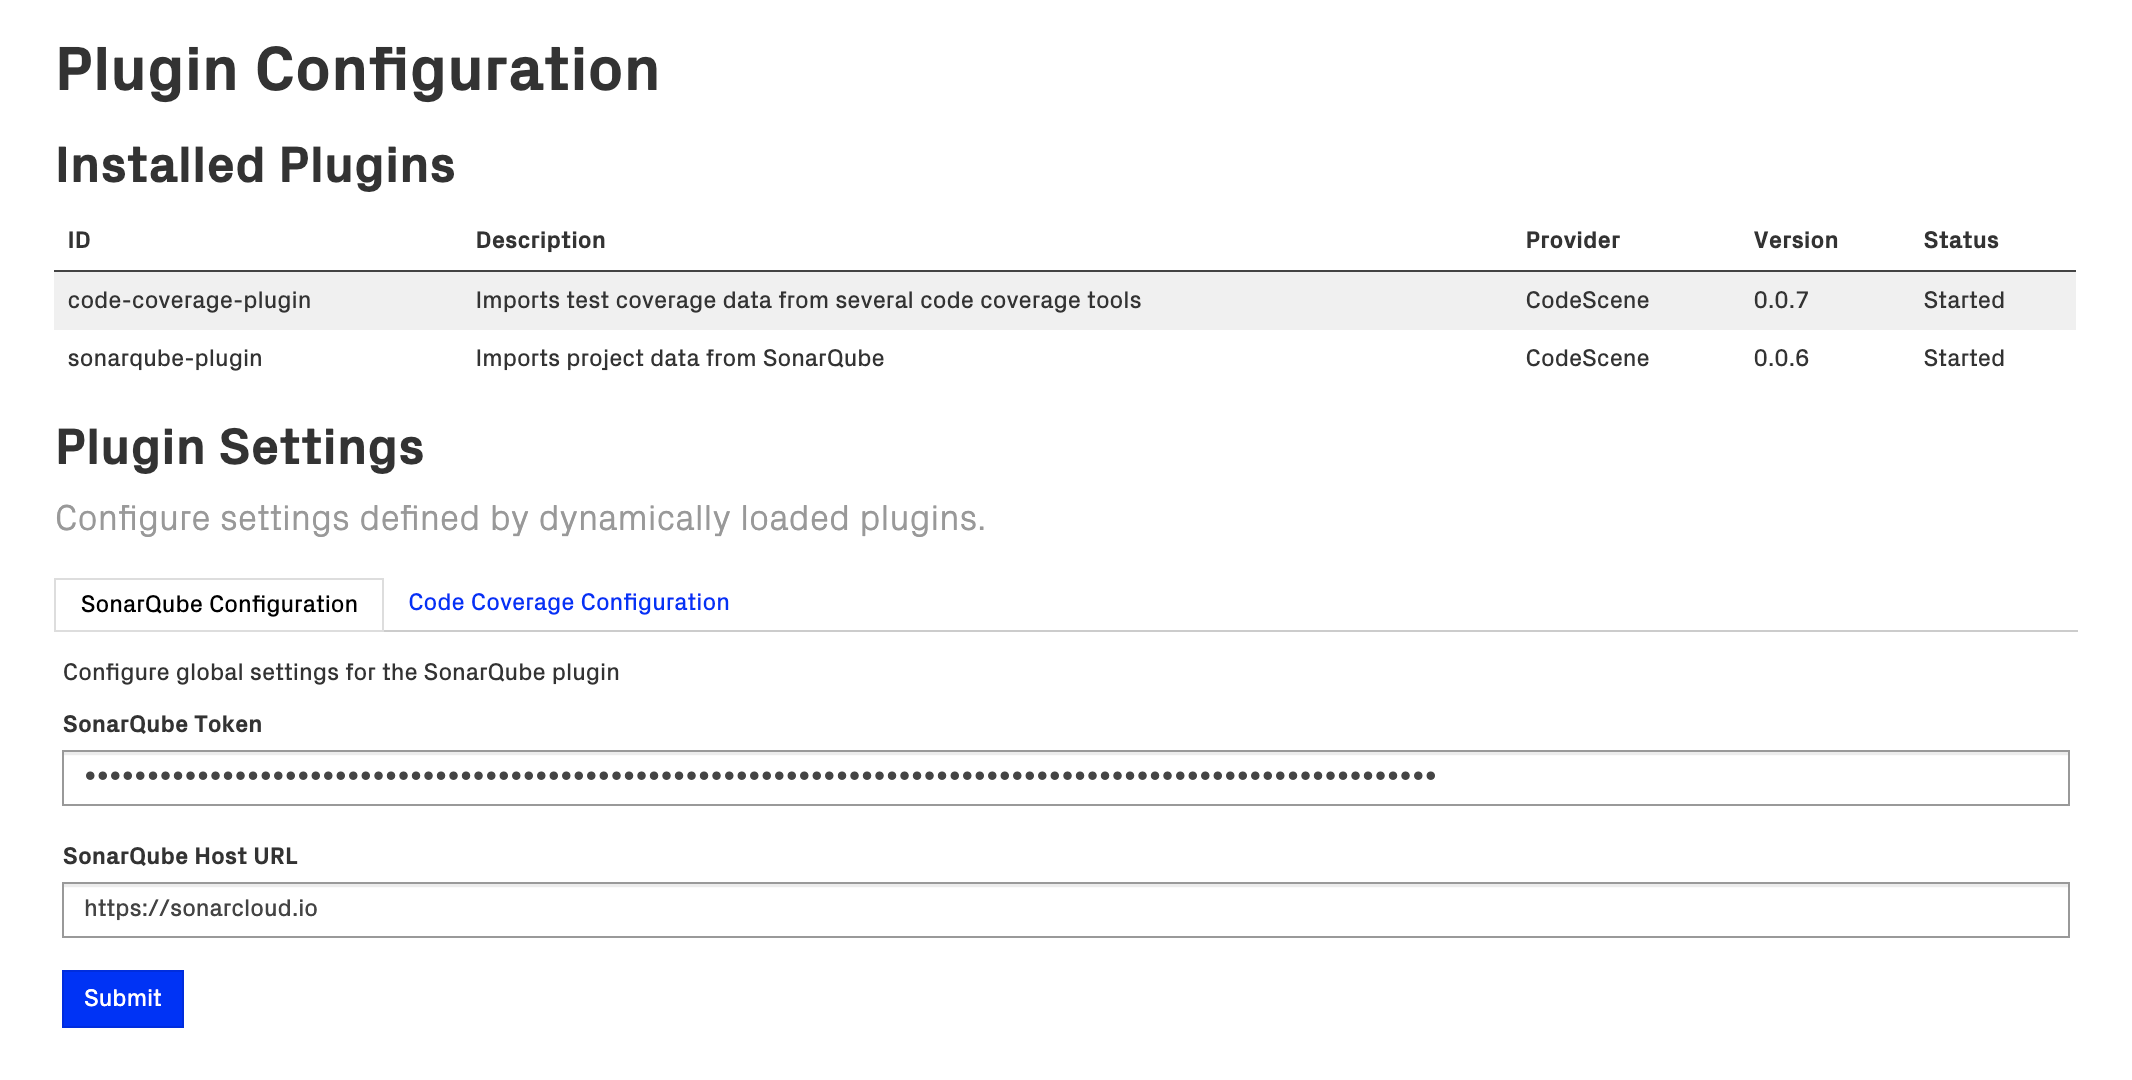
Fig. 49 Specify the Sonar access token globally so that it can be reused for all CodeScene projects.
The global configuration is typically done once by a CodeScene admin. Each project can now specify the Sonar metrics of interest:
Fig. 50 Configure the Sonar metrics of interest inside your CodeScene projects.
Visualize Code Coverage in CodeScene
Motivation: Code coverage is a set of metrics that shows how much of your source code that gets executed by automated tests. There is no such thing as a “good” coverage score – it all depends on context. For example, in a critical hotspot, you need a higher degree of coverage to refactor safely, whereas you can get away with a lower coverage in stable and well-understood parts of the codebase. CodeScene provides those priorities to put coverage metrics into context.
Select your Code Coverage Metrics
There are multiple code coverage metrics, and the most popular are:
Line coverage: which lines of code have been covered by automated tests?
Branch coverage: which execution paths have been covered by automated tests? For example, a line of code like if a && b can have full line coverage, but only partial branch coverage.
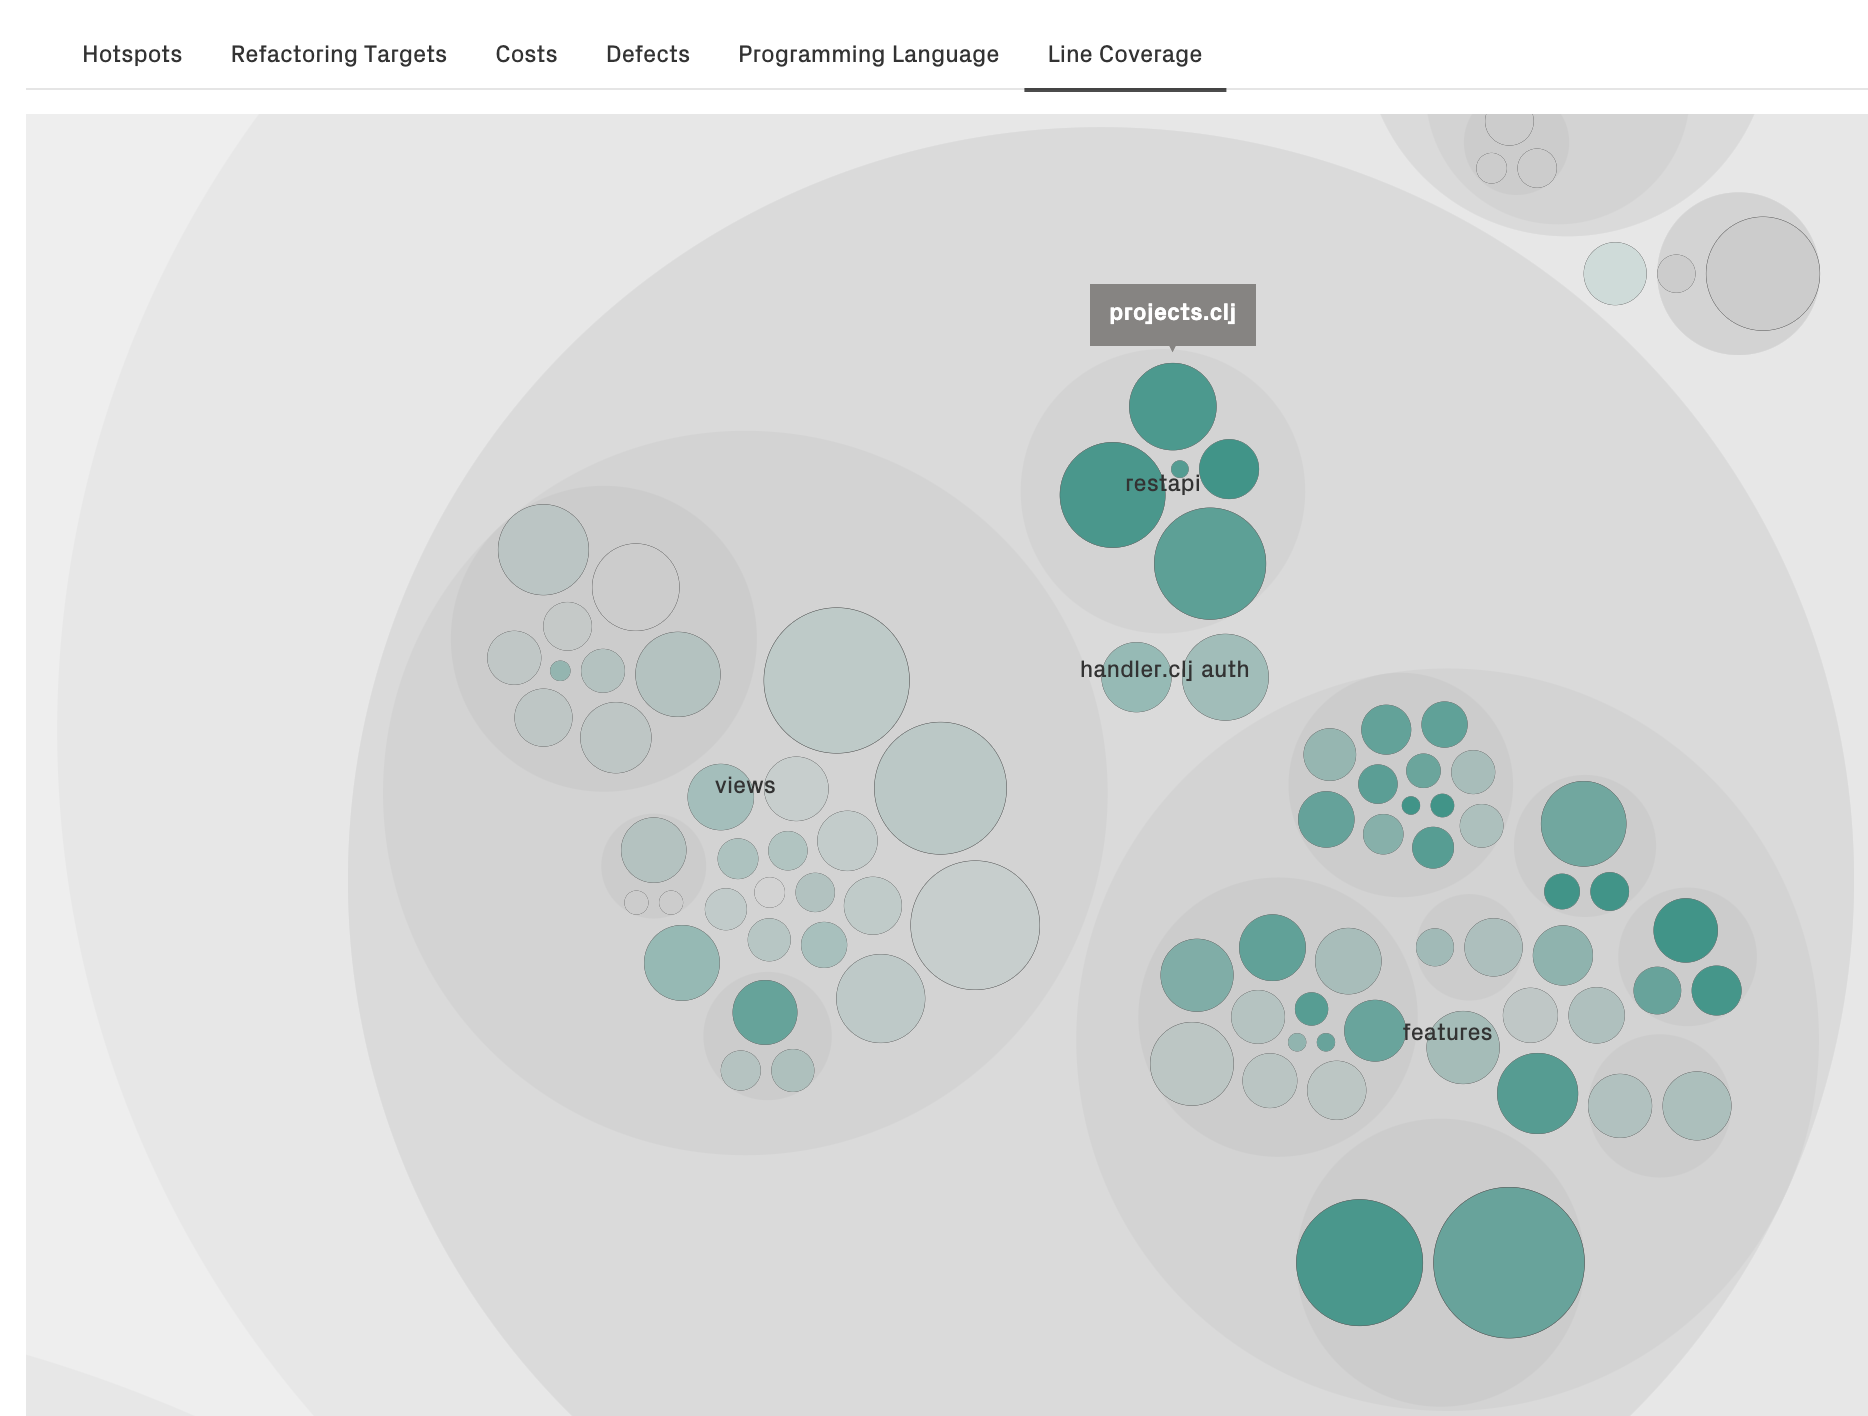
Fig. 51 CodeScene visualizes code coverage in its interactive views. The more green, the higher the coverage of that module.
Clicking on a specific module reveals the detailed metric (e.g. Line coverage: 85%).
The typical use cases are:
Mitigate risk: identify feature areas with low coverage before planning refactoring tasks. For example, refactoring a complex hotspot that doesn’t have adequate test coverage would be high risk.
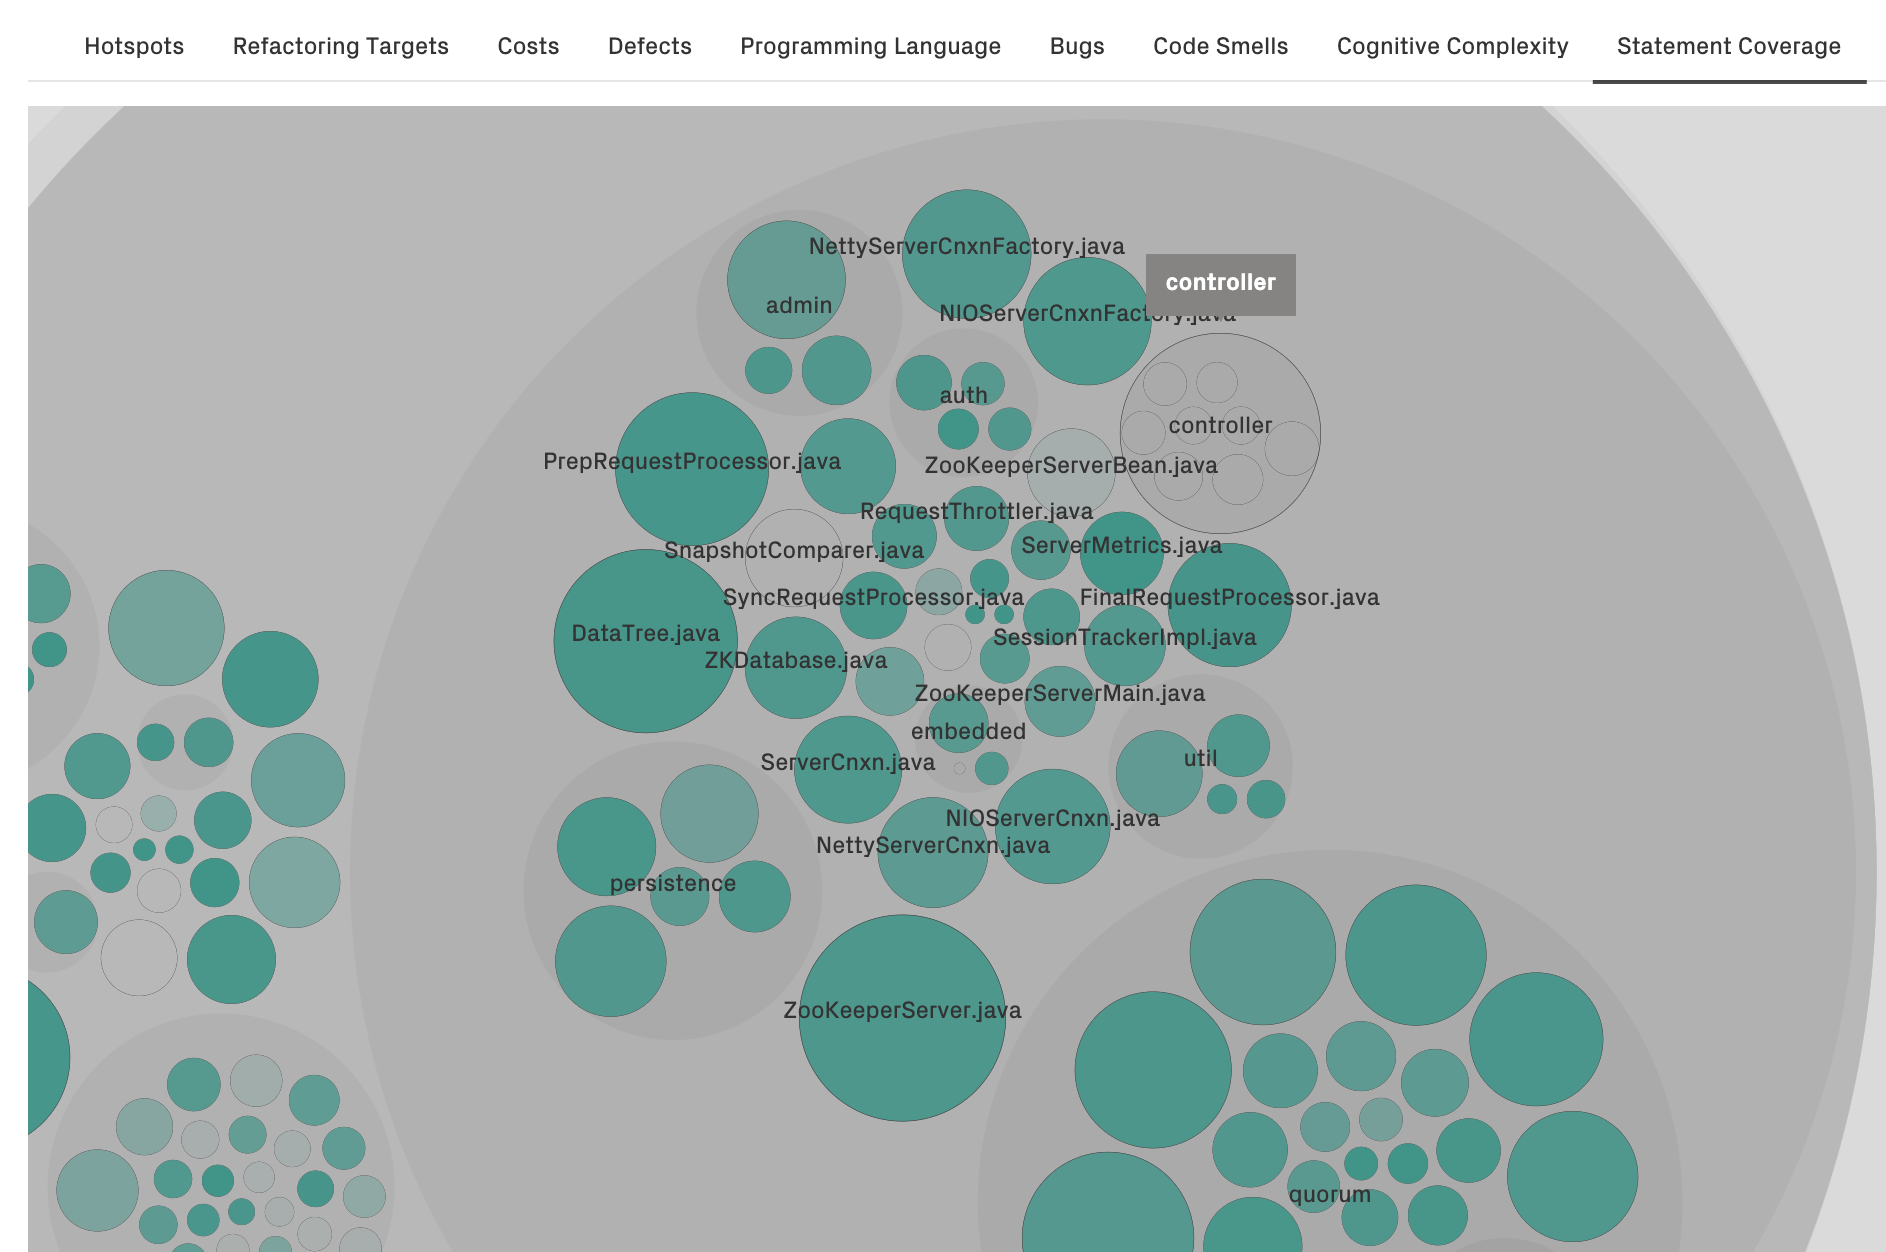
Fig. 52 Visualize areas of the code that lack test coverage (see the controller package in the image).
Detect deeper issues: CodeScene lets you customize your own views. For example, you can identify hotspots that a) have low code coverage, b) have low code health, and c) have many defects. That way, you can communicate the needs for pro-active improvements.
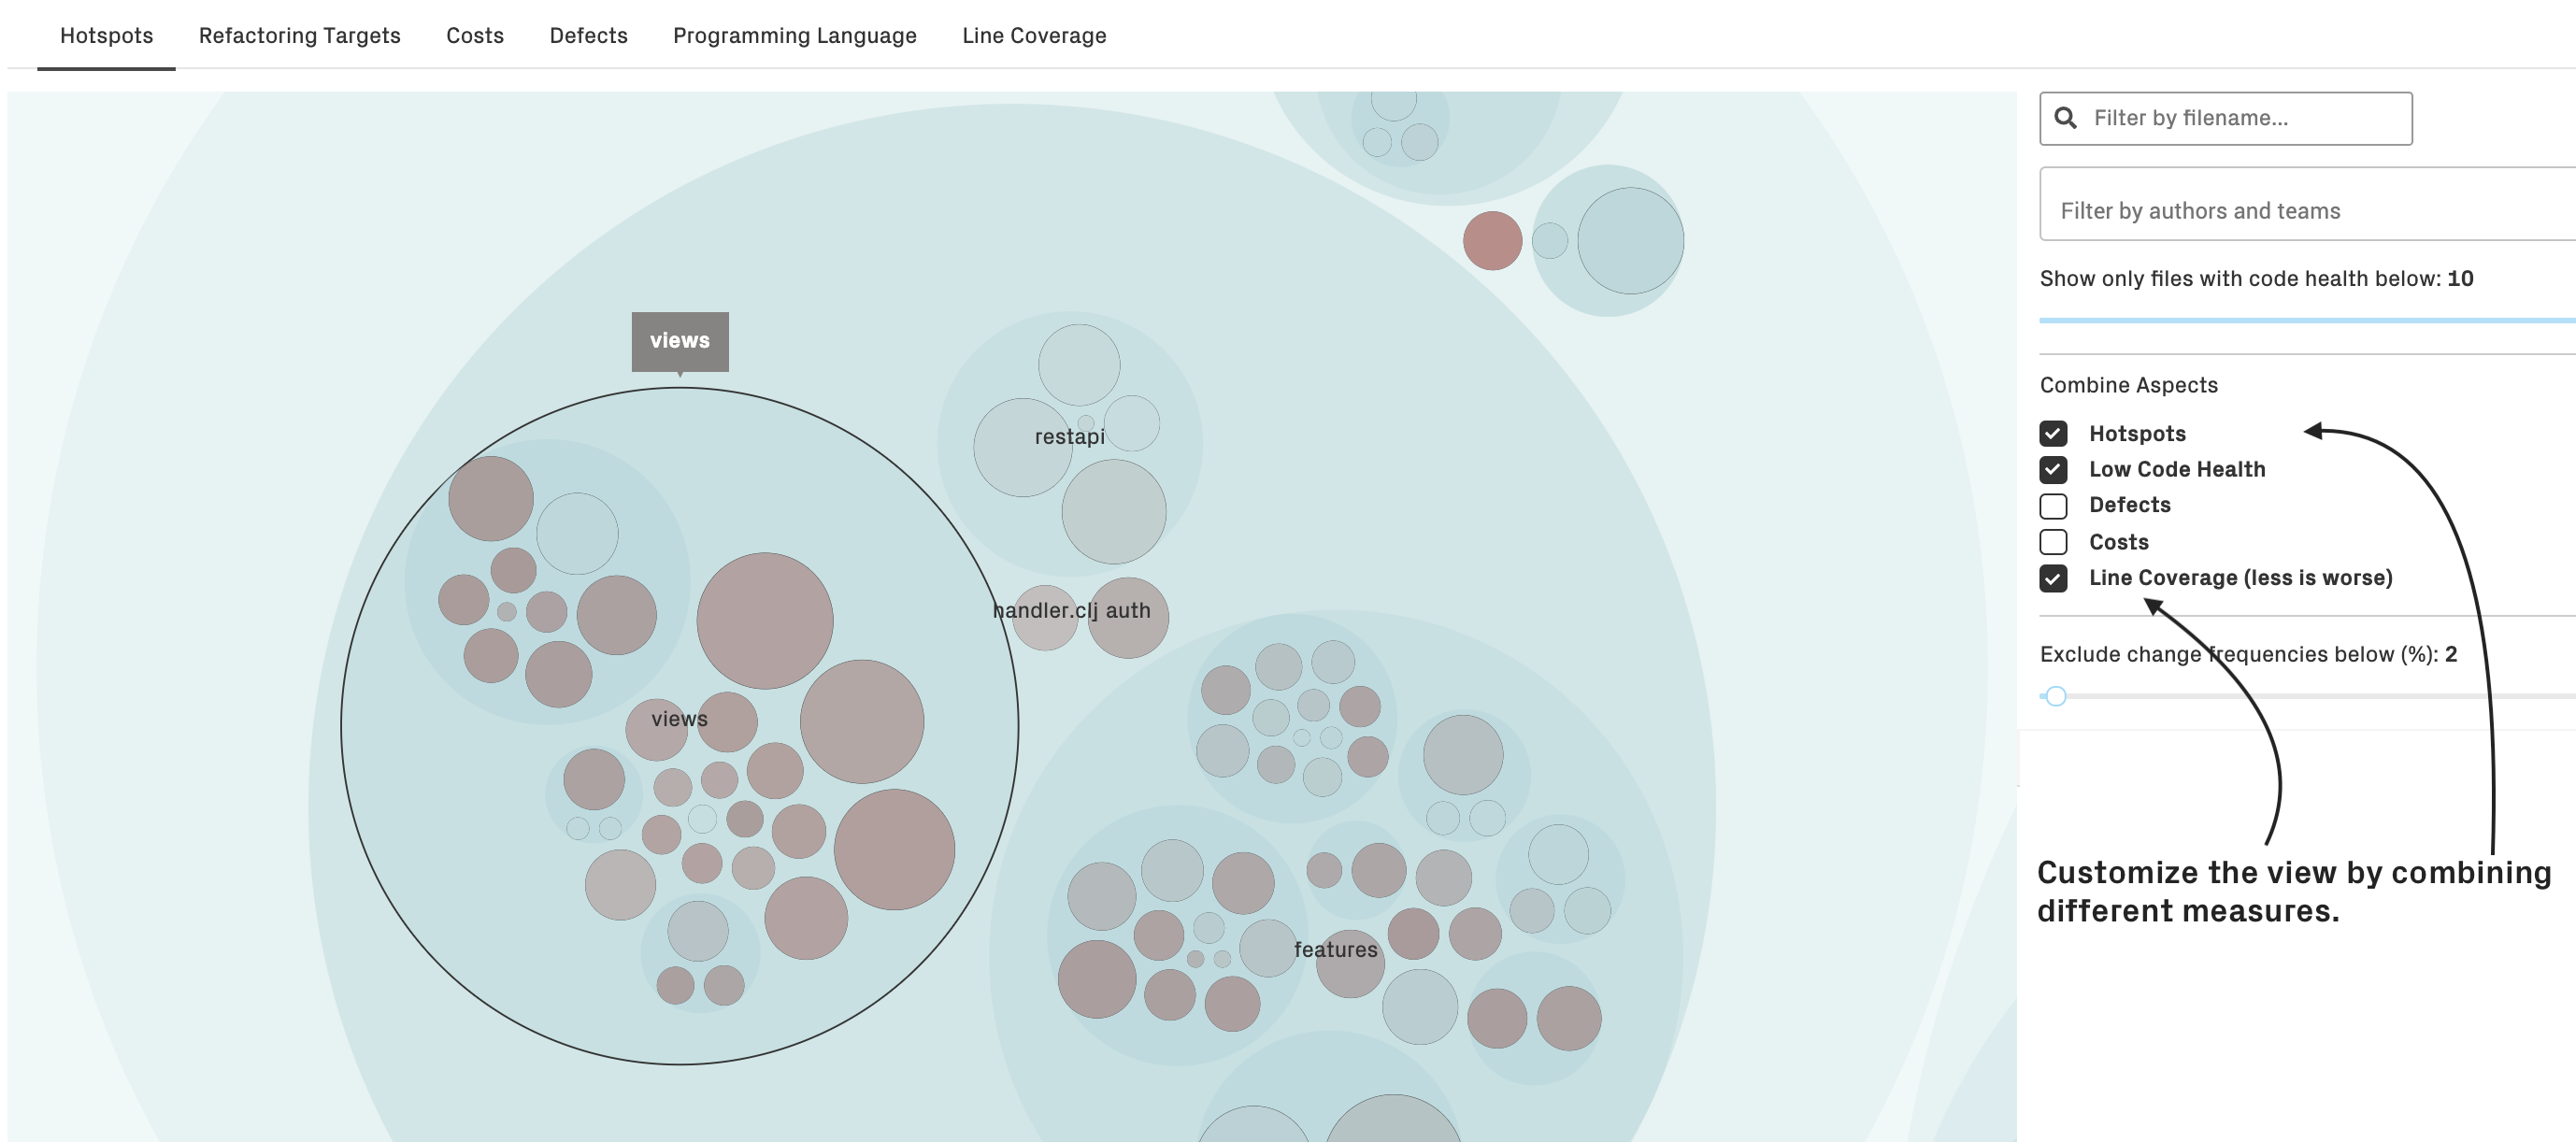
Fig. 53 Customize the interactive views to combine different aspects that highlights the perspective that’s important to you.
Configure the Code Coverage Plugin
You configure the code coverage plugin as part of your CodeScene project configuration, tab “Plugins.”
CodeScene’s code coverage plugin supports multiple coverage tools: OpenClover, Cobertura, JaCoCo, LCov, and BullsEye.
The plugin reads the metrics from the result files generated by these tools as part of a build pipeline:
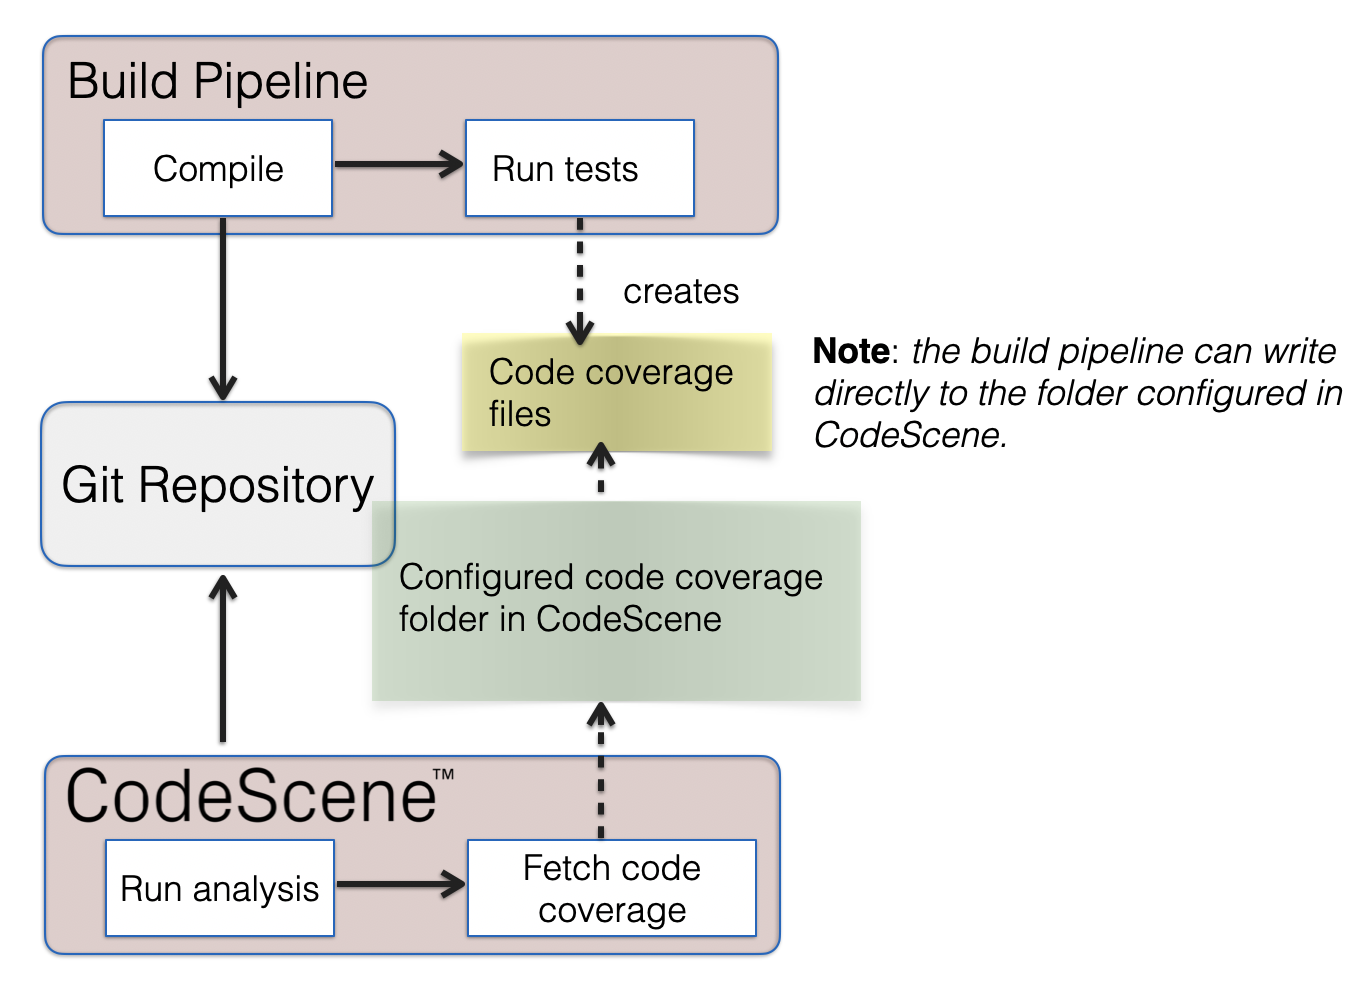
Fig. 54 The coverage results are generated as part of a build pipeline and shared with CodeScene.
CodeScene needs a way of accessing the result files, meaning you need to add a step to your build where the code coverage results are exported to a file folder readable by your CodeScene instance. Specify that path inside your project configuration. The path specification is a glob pattern relative to a global folder for code coverage metrics. Note that the global folder is an admin-level setting specified in the top level Configuration tab of CodeScene:
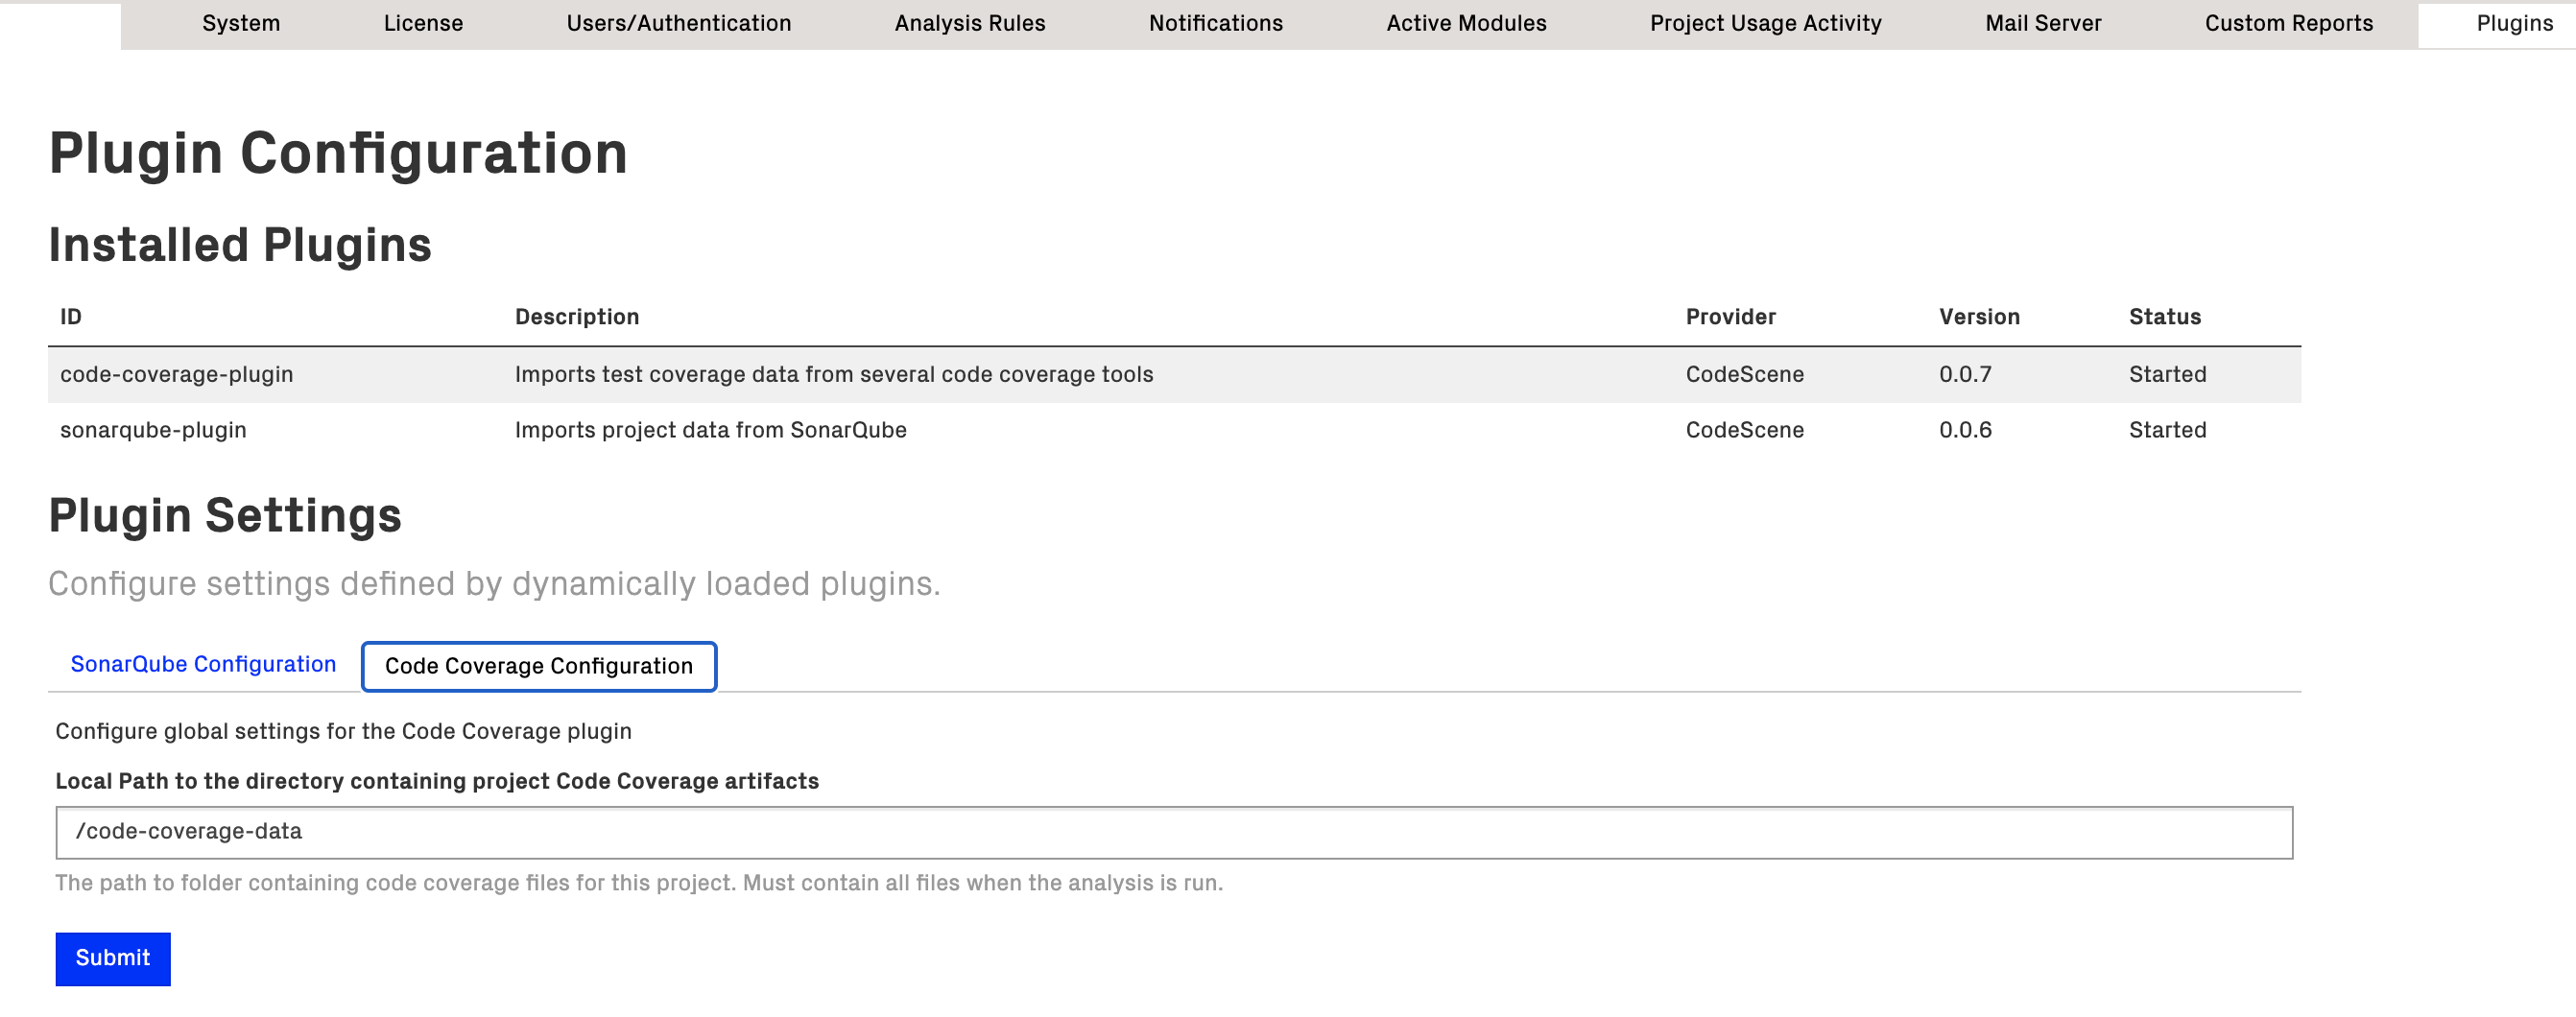
Fig. 55 The root folder of all code coverage results is a global setting that applies across all CodeScene projects.
From there, you select the test coverage metrics that you want to visualize. The available metrics depends on what the selected code coverage tool supports:
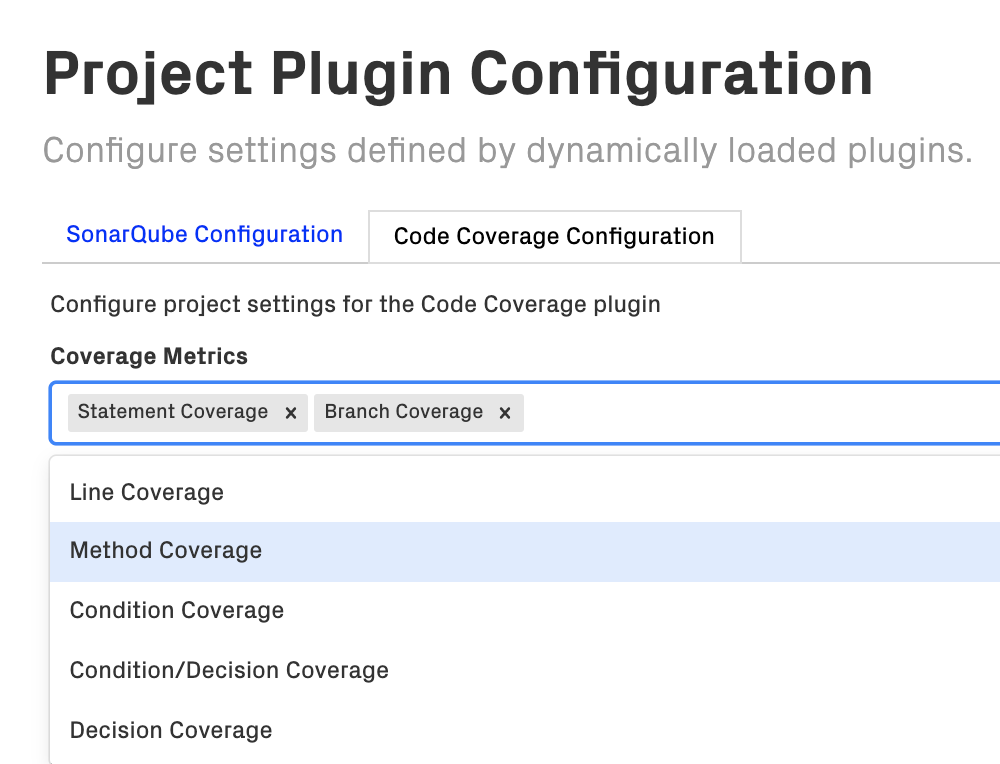
Fig. 56 Configure the code coverage metrics that you want to visualize and track inside CodeScene.
You can add multiple coverage metrics, and each one of them will show up as a perspective on the interactive hotspot map.
Code Coverage: Limitations
CodeScene supports analysis projects with multiple repositories. Since code coverage results don’t contain any info on repositories, CodeScene needs to match the directory structure of the coverage results to the corresponding Git repo.
This works well for programming languages that enforce unique paths (e.g. Java) but can lead to ambiguity in the rare case where the exact same file path exists in multiple Git repositories.