Project Management Analyses
CodeScene’s suite of project management metrics let you measure where you spend your costs and inspect both cost and activity trends. The analysis lets you assess costs on both the architectural level, such as components and sub-systems, as well as on individual files.
The Need for Project Management Metrics
CodeScene’s project management metrics answer two common questions:
How shall we prioritize improvements to our codebase?
How can we follow-up on the effects of the improvements we do?
Sure, our Hotspot analysis already addresses these questions and gives us a tool to prioritize. However, there’s a linguistic chasm between developers and managers here; To a manager, a “commit” doesn’t carry much meaning. A commit is a technical term that doesn’t translate to anything in the manager’s world. At the same time, technical debt and low quality code are important subjects to address. So how can we talk the language of a manager while still tying our data back to something that communicates with the developers responsible for the code?
CodeScene bridges this chasm by introducing a suite of project management metrics. These metrics combines our existing version-control measures with data from Jira. This gives you Hotspots measured by cost rather than the more technical change frequency metric. It also gives you trends in both your costs and the type of work you do (e.g. features vs maintenance). Let’s see how it is done.
Learn to Interpret the Project Management Metrics
You need to configure CodeScene to access the Jira service. Once that’s done, CodeScene will automatically retrieve the Jira data and run an analysis on it.
Click on the Project Management tile to get to the detailed results. The detailed results presents Hotspots by cost and let you access the trends. Let’s look at some examples.
The Hotspots by Costs provide an overview of which part of the code that are the most expensive to maintain. The analysis works just like the normal technical Hotspot analysis. The main difference is that these Hotspots are ranked by cost rather than the change frequency of the code. You see an example in Fig. 151
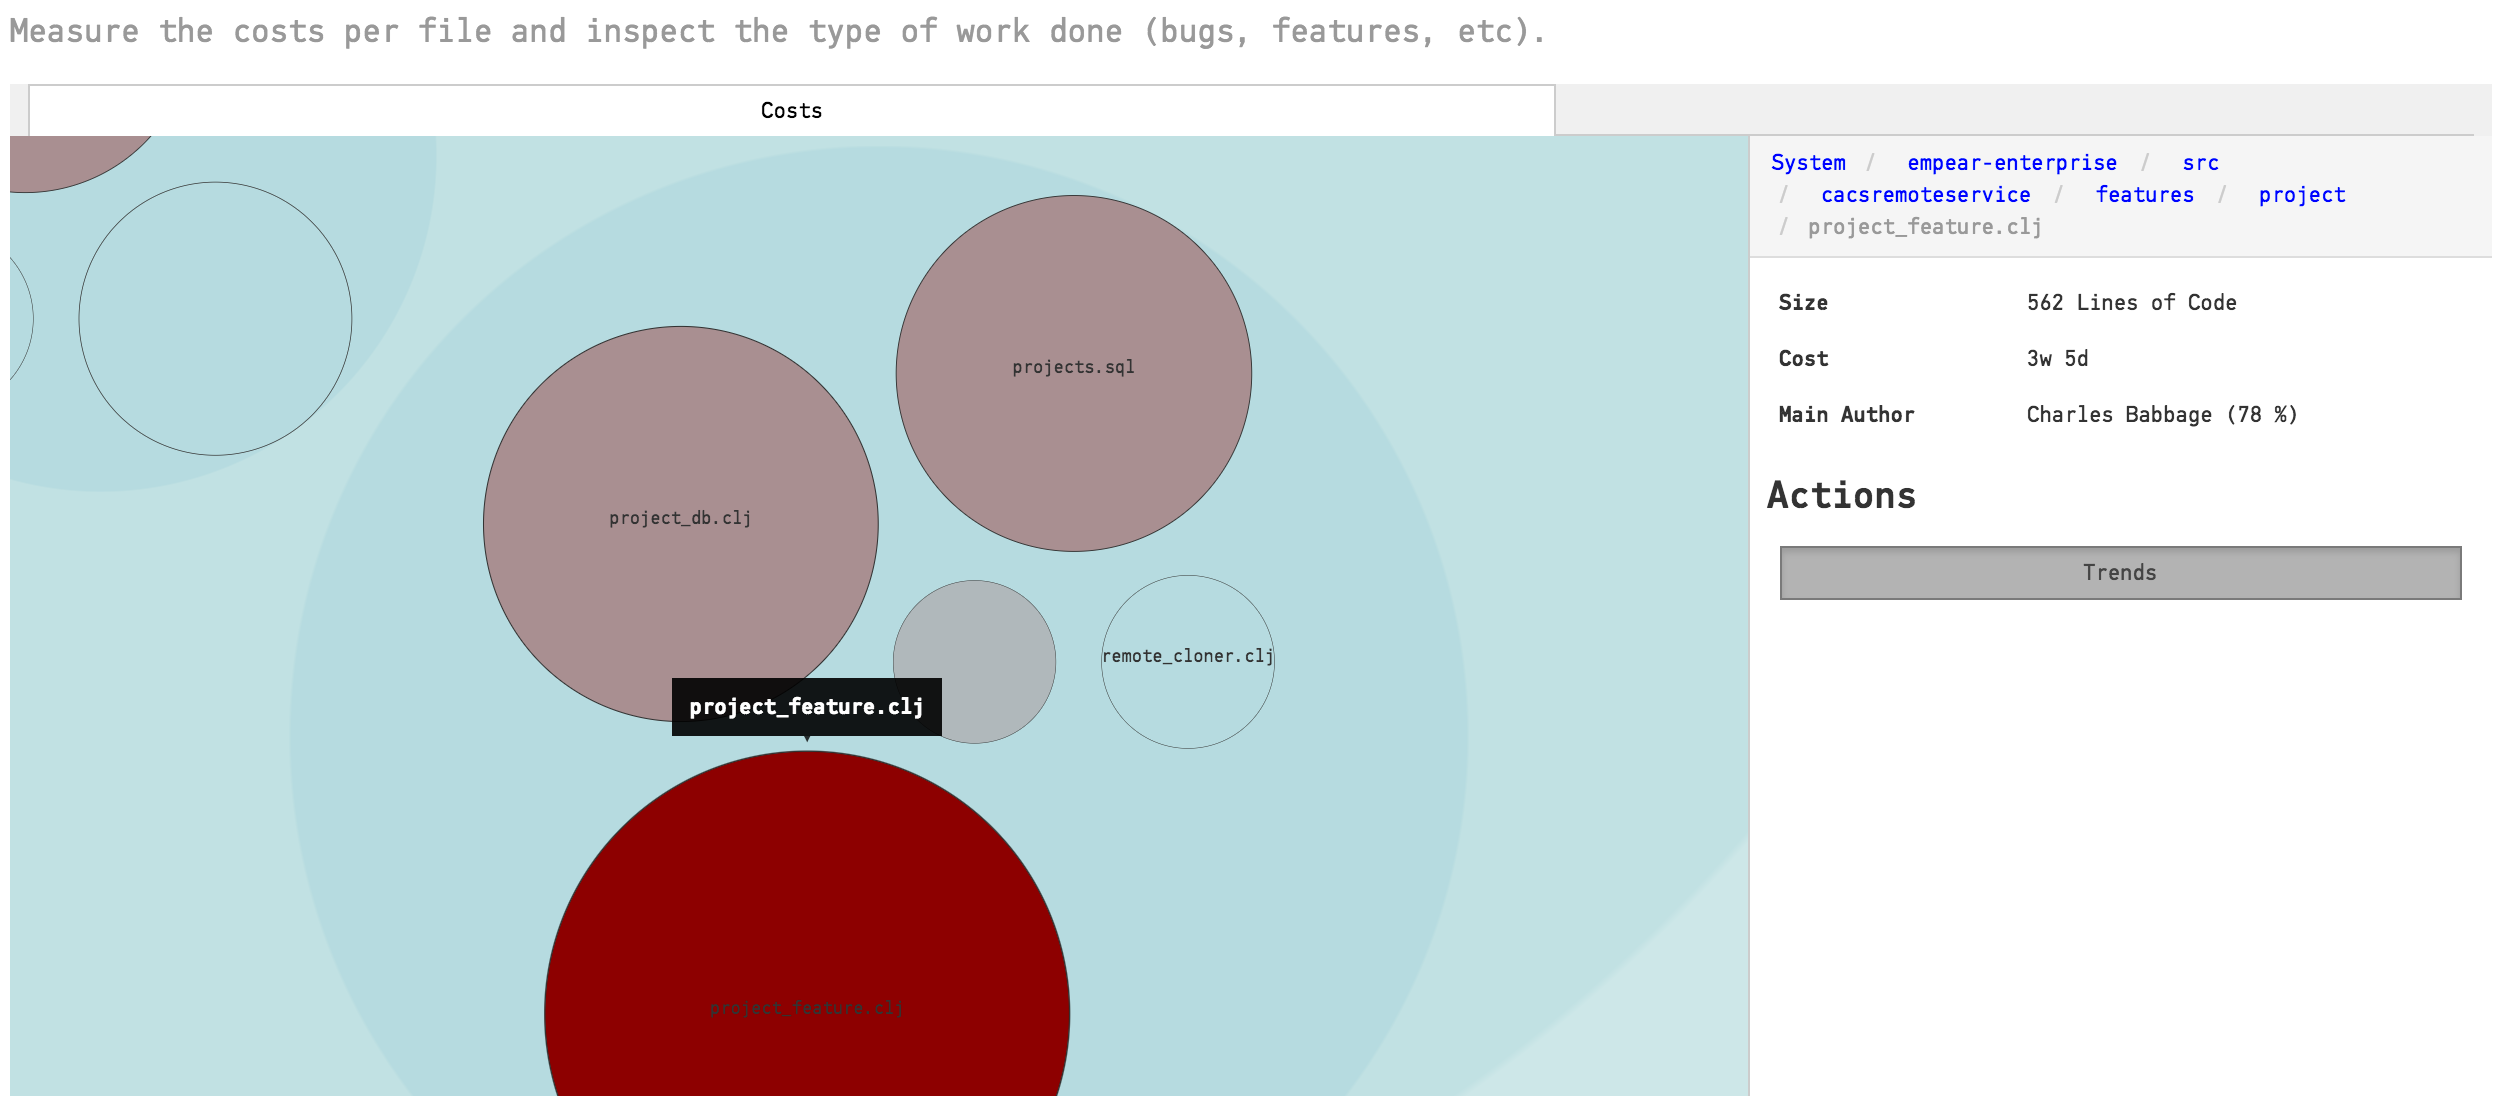
Fig. 151 A Hotspot analysis by cost lets you see where you spend most time.
As you see in Fig. 151, most time is spent in a module named project_feature.clj. That means you want to prioritize improvements to that code. Before you do that, however, you’d like to look at the cost trend to see if this is recently accumulated cost or if the Hotspot has been expensive to maintain for a long time.
You access the cost trends by clicking on a Hotspot and select Trends.
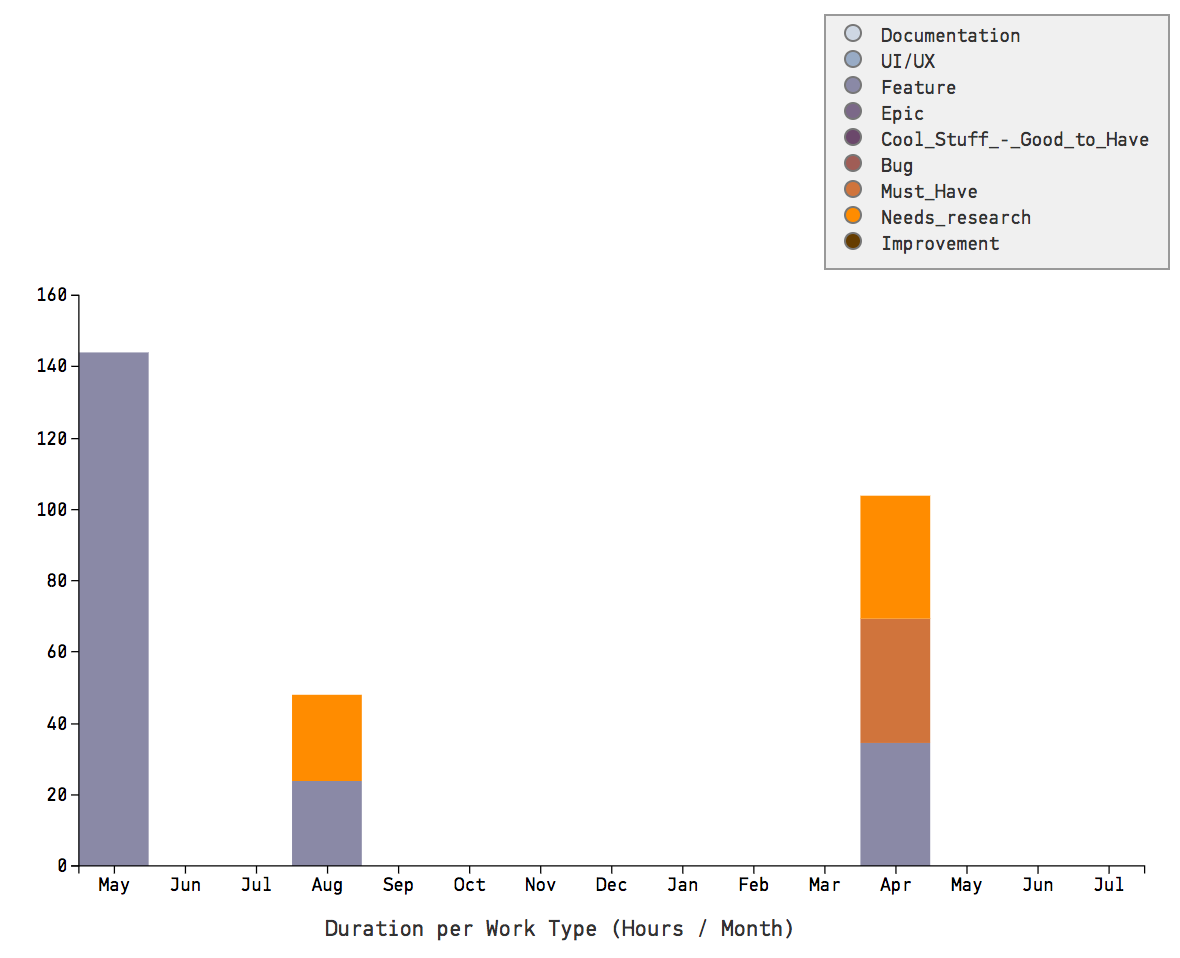
Fig. 152 Use the trends in type of work to see where your time is spent.
The cost trend is presented in two different graphs:
The first graph will show the accumulated cost by month for the selected Hotspot. The costs are a summary of all Jira issues that have involved work in this specific Hotspot, as illustrated in Fig. 152.
The second graph shows the cost distributed across the type of work you’ve done.
You use this information to ensure that the code evolves in the right direction. For example, you’d like to see a decrease in the amount of bugfixes and an increase in the amount of feature related issues. You can also use the cost trends to measure the effect of large-scale improvements as illustrated in Fig. 153.
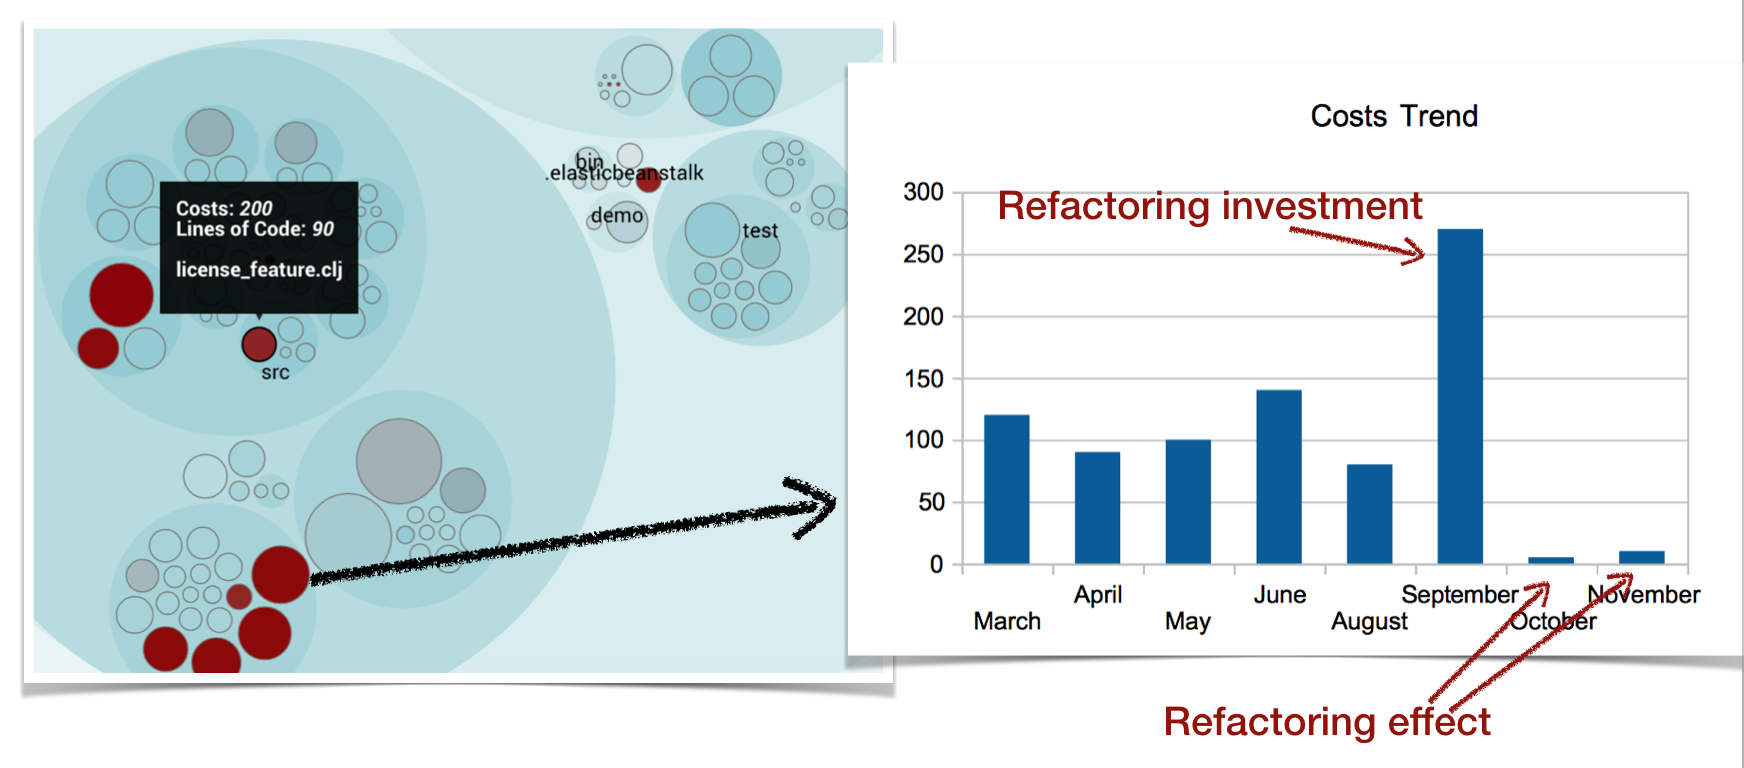
Fig. 153 Use the Cost Trends to measure the effect of improvements.
Measure Costs and Activity on Sub-Systems
In many systems the semantically interesting unit isn’t individual files but rather sub-systems and components. Thus, CodeScene calculates the same cost metrics on an architectural level too. All you have to do is to enable your architectural analyses.
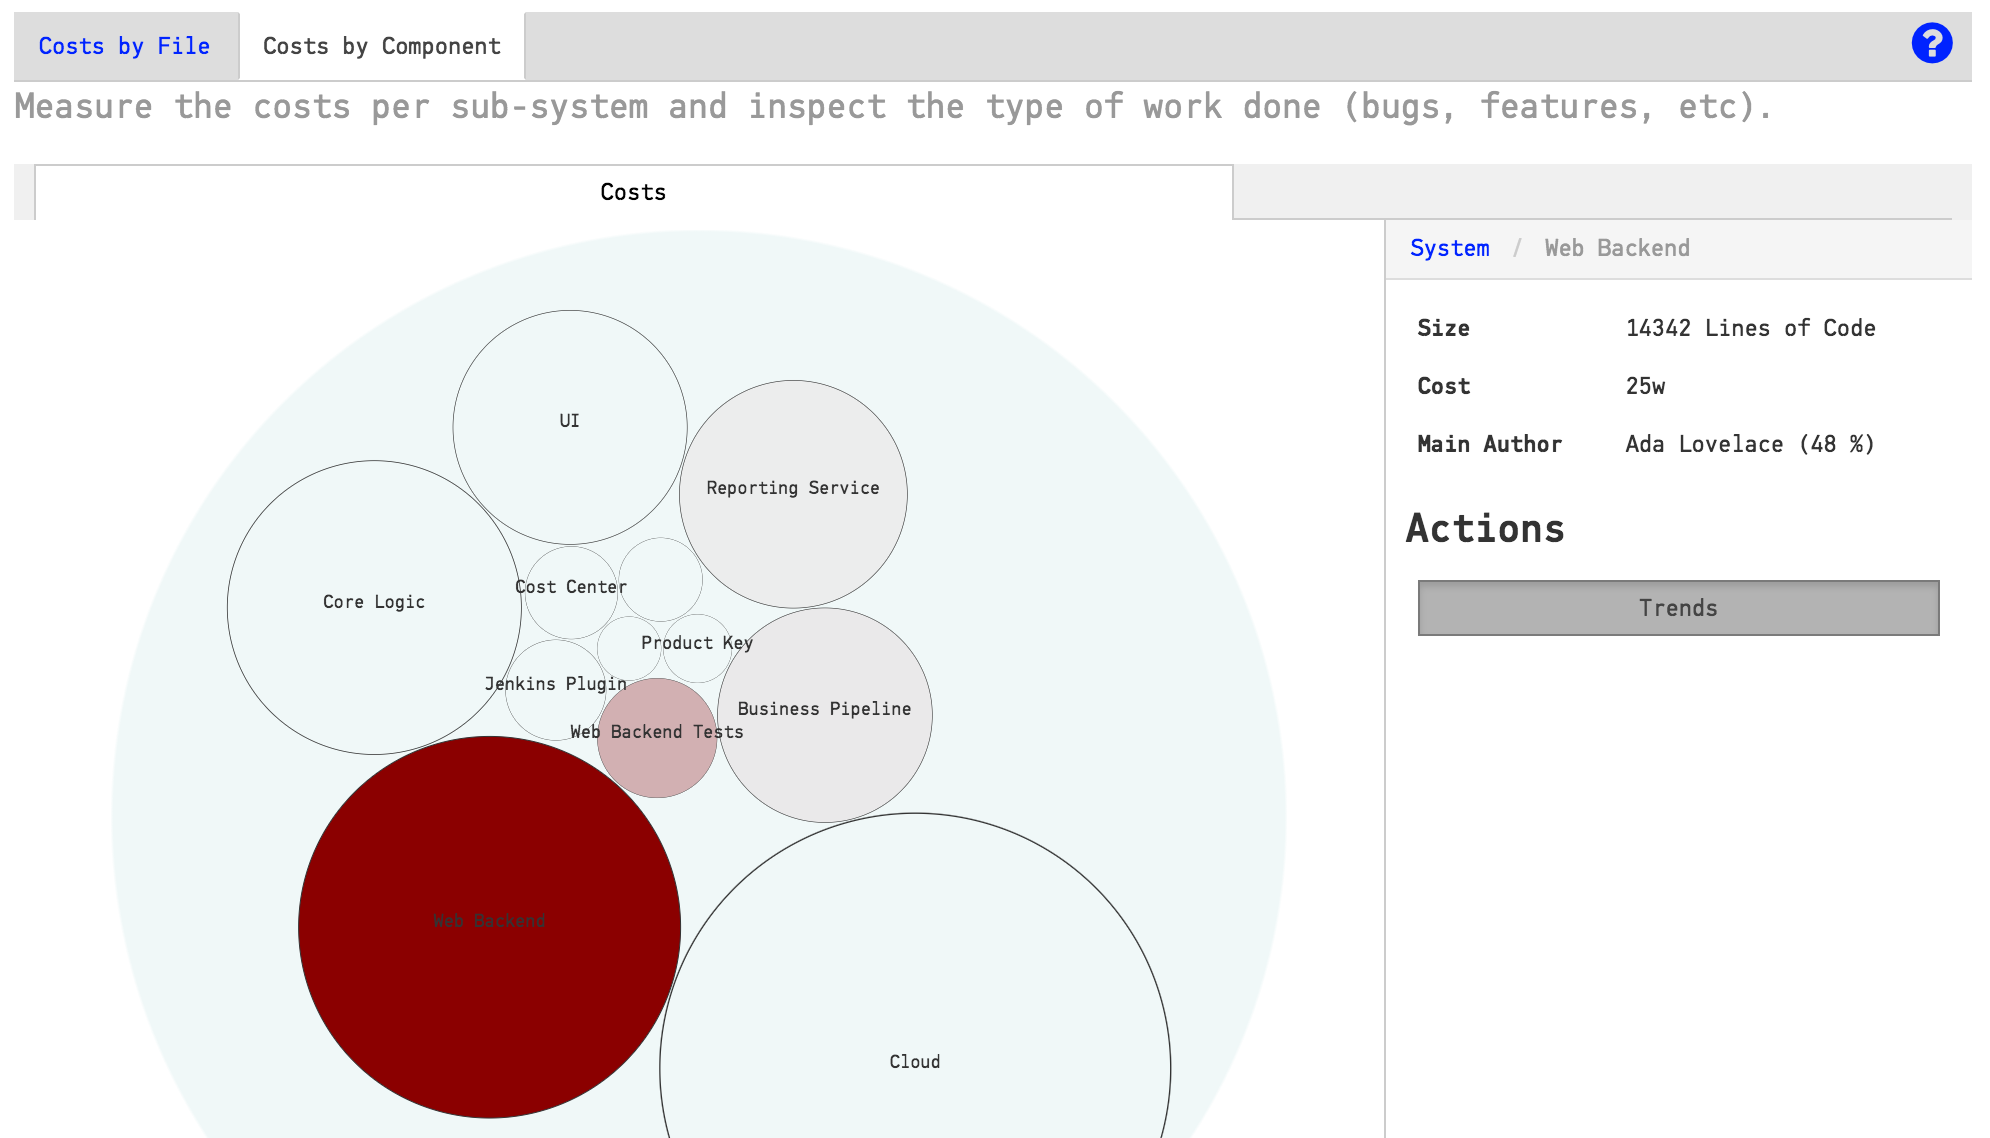
Fig. 154 Calculate hotspots by costs on architectural level
This kind of information gives you an overview of the costs on the sub-system level, and represents information that is relevant to non-technical managers too. Thus, use the analysis on this level to bridge the gap between the technical side of the organization and the business side by letting everyone share a common picture of how the system evolves.
A Note to Developers
You’ll probably notice a high correlation between the project management results and the results from the technical Hotspot analysis. This is an expected finding. However, the project management metrics have another usage. Since the project management metrics speak the language of a non-technical managers, these analyses provide a basis for communication. Use this data to motivate investments in software quality, like for example to explain the need for a larger refactoring of one ore more top Hotspots.
Pre-Requisites for the Project Management Analyses
This suite of analyses fetches data from a project management tool like Jira. CodeScene provides a Jira integration as a separate service. However, the Jira data only contains the raw costs (hours, story points, etc) of a story - there’s no specification of how those costs are shared across the different parts of your codebase.
CodeScene solves this problem by mapping the Jira data to our wealth of version-control metrics. There are a number of pre-requisites that are mandatory for this process to work:
You need to include your Jira Ticket/Issue/Story ID in the commit messages. We use that information to unify the data sources.
You need to have a cost metric in your Jira story. CodeScene supports time-based costs (i.e. minutes of time to completion) and story points.
Limitations in the Analysis Data
The cost trends and analysis results will never be better than the available raw Jira data. That is, if your reported costs on a Jira story are too far off, the analysis don’t have any way to adjust it.
In addition, there are a number of limitations that you need to be aware of:
The total costs for a Jira issue are assigned to the last known month that the issue was worked on. So if you have long-running issues, you’ll see the costs assigned to a single month even if the issue took, let’s say, 3 months to implement.
All files that were worked upon in a Jira issue get assigned the same cost. In reality, some files typically account for a larger amount of the total costs, but there’s no way for CodeScene to know that. Instead we treat each file as an equal contributor to the issue. Note that the architectural level analyses mitigate this issue as they show the aggregated costs.
In general, you’ll find that you get much more out of the analysis results as long as you remember that the project management metrics are heuristic in their nature rather than precise predictions of the future.