Code Health – How easy is your code to maintain and evolve?
Code quality issues cost time, money, and missed deadlines. It’s vital for decision making to know when you can safely move ahead and implement new features as well as when you might have to take a step back and improve what’s already there. That way, your system remains maintainable which is the foundation for developer productivity and great products.
CodeScene’s code health measure points gives you a straightforward overview that lets your team drill down to the code with actionable recommendations. It’s a game changer – understanding the code quality of a large-scale codebase has never been this easy!
Code Health identifies factors known to impact Maintenance costs and Delivery Risks
The Code Health metrics is based on patterns known to correlate with increased maintenance costs. Patterns that make the code harder to understand and, hence, increase the risk of change and make the module more expensive to evolve. Recent research has also found that low code health leads to a high number of total security errors. So code health captures both a productivity as well as a correctness dimension.
The Code Health score goes from 10 (healthy code that relatively easy to understand and evolve) down to 1, which indicates code with severe quality issues. The score is calculated from a combination of both properties of the code as well as organizational factors. In total, CodeScene calculates 25-30 factors depending on programming language. Examples include – but are not limited to – the following:
Brain Method: A single function/method that centers too much behavior and becomes a local hotspot.
Nested Complexity: This is typically revealed as if-statements inside other if-statments and/or loops, and is a construct that significantly increases the risk for defects.
Bumpy Road: A bumpy road is a function that fails to encapsulate its responsibilities, leading to code containing multiple logical chunks of logic. Just like a bumpy road will slow down you driving, a bumpy road in code presents an obstacle to comprehension. There’s also an increased risk for feature entanglement. The remedy is often to extract and encapsulate the chunks of logically dispersed behaviors in their own functions.
Developer Congestion: Code becomes a coordination bottleneck when multiple developers need to work on it in parallel (see Parallel Development and Code Fragmentation).
Knowledge Loss due to former contributors: If the developer behind a hotspot with low code healt leaves the organization, the maintenance risk increases significantly.
DRY (Don’t Repeat Yourself) Violations: CodeScene detects duplicated logic that is actually changed together in predictable patterns.
Primitive Obsession: Code that uses a high degree of built-in, primitives such as integers, strings, floats, often lacks a domain language that encapsulates the validation and semantics of function arguments.
The Code Health trends can be automatically supervised in your CI/CD pipeline and/or Pull Requests, so check out how to enable that integration: Integrate CodeScene in your CI/CD Pipeline
Adapt Code Health to your Coding Standards
CodeScene’s code health rules are calibrated against real-world codebases. As such, the default rules represent the state of the art when it comes to predicting maintenance and delivery risks. That said, we understand that users want a certain level of control over the code health rules.
The code health rules are customized by adding a .codescene/code-health-rules.json file to your Git repositories. That way, the code health rules are persisted and version-controlled together with the application code they apply to.
CodeScene provides a template JSON file that includes documentation. You access that file via the Hotspots sections of your project’s configuration. Let’s start by looking at the configuration options:
Example on overridden code health rules
.codescene/code-health-rules.json
{
  "usage" : "Persist this file inside your repositories as  ...",
  "rule_sets" : [ {
    "matching_content_path" : "test/**",
    "matching_content_path_doc" : "Specify a glob pattern relative to ...",
    "rules" : [ {
      "name" : "Brain Method",
      "weight" : 0.5
    }, {
      "name" : "Large Method",
      "weight" : 0.0
    } ]
  } ]
}
Starting from the JSON template that you get via CodeScene’s configuration view:
Remove any rules that you want to keep as-is. This prevents clutter in the config file.
Specify a weight of 0.0 to disable a rule. See “Large Method” above for an example.
Specify a lower weight for the rules you want to keep but down-prioritize. See “Brain Method” above for an example. A value of 0.5 still implies a code health hit but only at 50% of the default impact.
Commit the .codescene/code-health-rules.json file inside your repository.
Limit the customized rules to part of your code
The .codescene/code-health-rules.json file lets you limit the customization to a part of your codebase. This is done via glob patterns as specified by the matching_content_path field. Common examples include:
Differentiate between test and application code: Maybe you want to allow your test suites to grow slightly larger, or perhaps you want to allow a certain degree of code duplication between test methods. Specify a rule set for the pattern test/**, which means all code in a top-level test folder.
Use different rules for different programming languages: As an example, **/*.js means just JavaScript code. Other languages aren’t impacted by these overriden rules.
Note that you can have multiple rule sets – each one matching one piece of content – inside the same configuration file.
What happens to disabled rules?
Disabled rules are no longer be part of the code health calculation. This means the reported code health can look better than the initially reported baseline.
Disabled rules will not be presented in the virtual code review.
Disabled rules will not be supervised as part of the delta analysis and PR quality gates.
To ensure transparency, CodeScene presents a searchable summary of all overridden rules. You find that summary under the Scope section of each analysis:
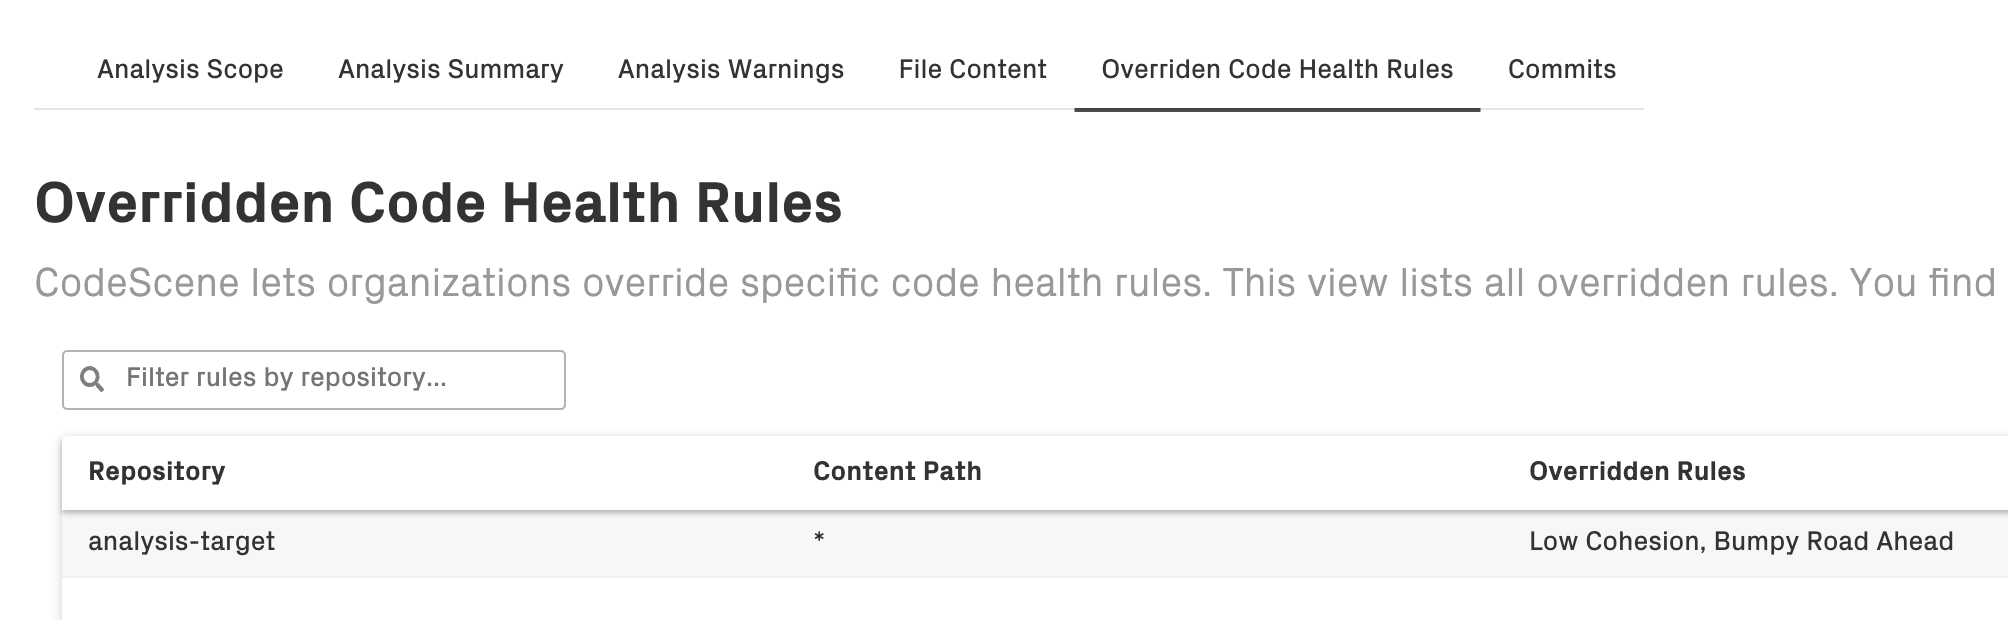
Fig. 80 CodeScene presents a searchable summary of all overridden code health rules
Advanced: use multiple rule sets and global code health rules
CodeScene lets you point out one specific repository – via the project configuration – that serves as the source for global rules. These global rules will apply across all Git repos in your project. Typically, the global rules are used to reflect organization wide coding rules.
The global rules are overridden by .codescene/code-health-rules.json inside each repository. Hence, the hierarchy is:
Local rules inside a repository have the highest precedence.
The global rules specified in your project configuration has the second precedence.
If none of those rules match, we use CodeScene’s defaults, meaning maximum relative weight for each rule.
Recommendations for customizing code health rules
Our recommendations for customizing the code health rules:
Never disable the hard rules: The individual code health metrics come in two categories: 1) rules and 2) heuristics. While the heuristics might be at odds with your internal coding standards, the rules are hard to argue against. Disabling rules might mean that you miss an opportunity to act early on potential problems.
The Principles Behind Code Health
We make heavy use of CodeScene ourselves. Over the past years we have analyzed hundreds of different codebases, and there are some patterns that we have seen repeated over and over again. Thus, we started to implement support in CodeScene to auto-detect those patterns, and we called the feature code health.
The name requires a brief explanation. In general, we wanted to avoid terms like “quality” or “maintainability” since they are easy to game and, more serious, suggest an absolute truth. Instead we find that it’s the trend that’s most important: is the code evolving in the desired direction? In addition, an algorithm, no matter how smart, can only take us so far; at some level we want a human in the loop, and the code health trends are there to support that person. Let’s look at some use cases.
Explore your Code’s Biomarkers
If CodeScene has biomarker support for your language (see X-Ray for a list of supported languages), you will get a high-level trend on your dashboard as shown in Fig. 81.
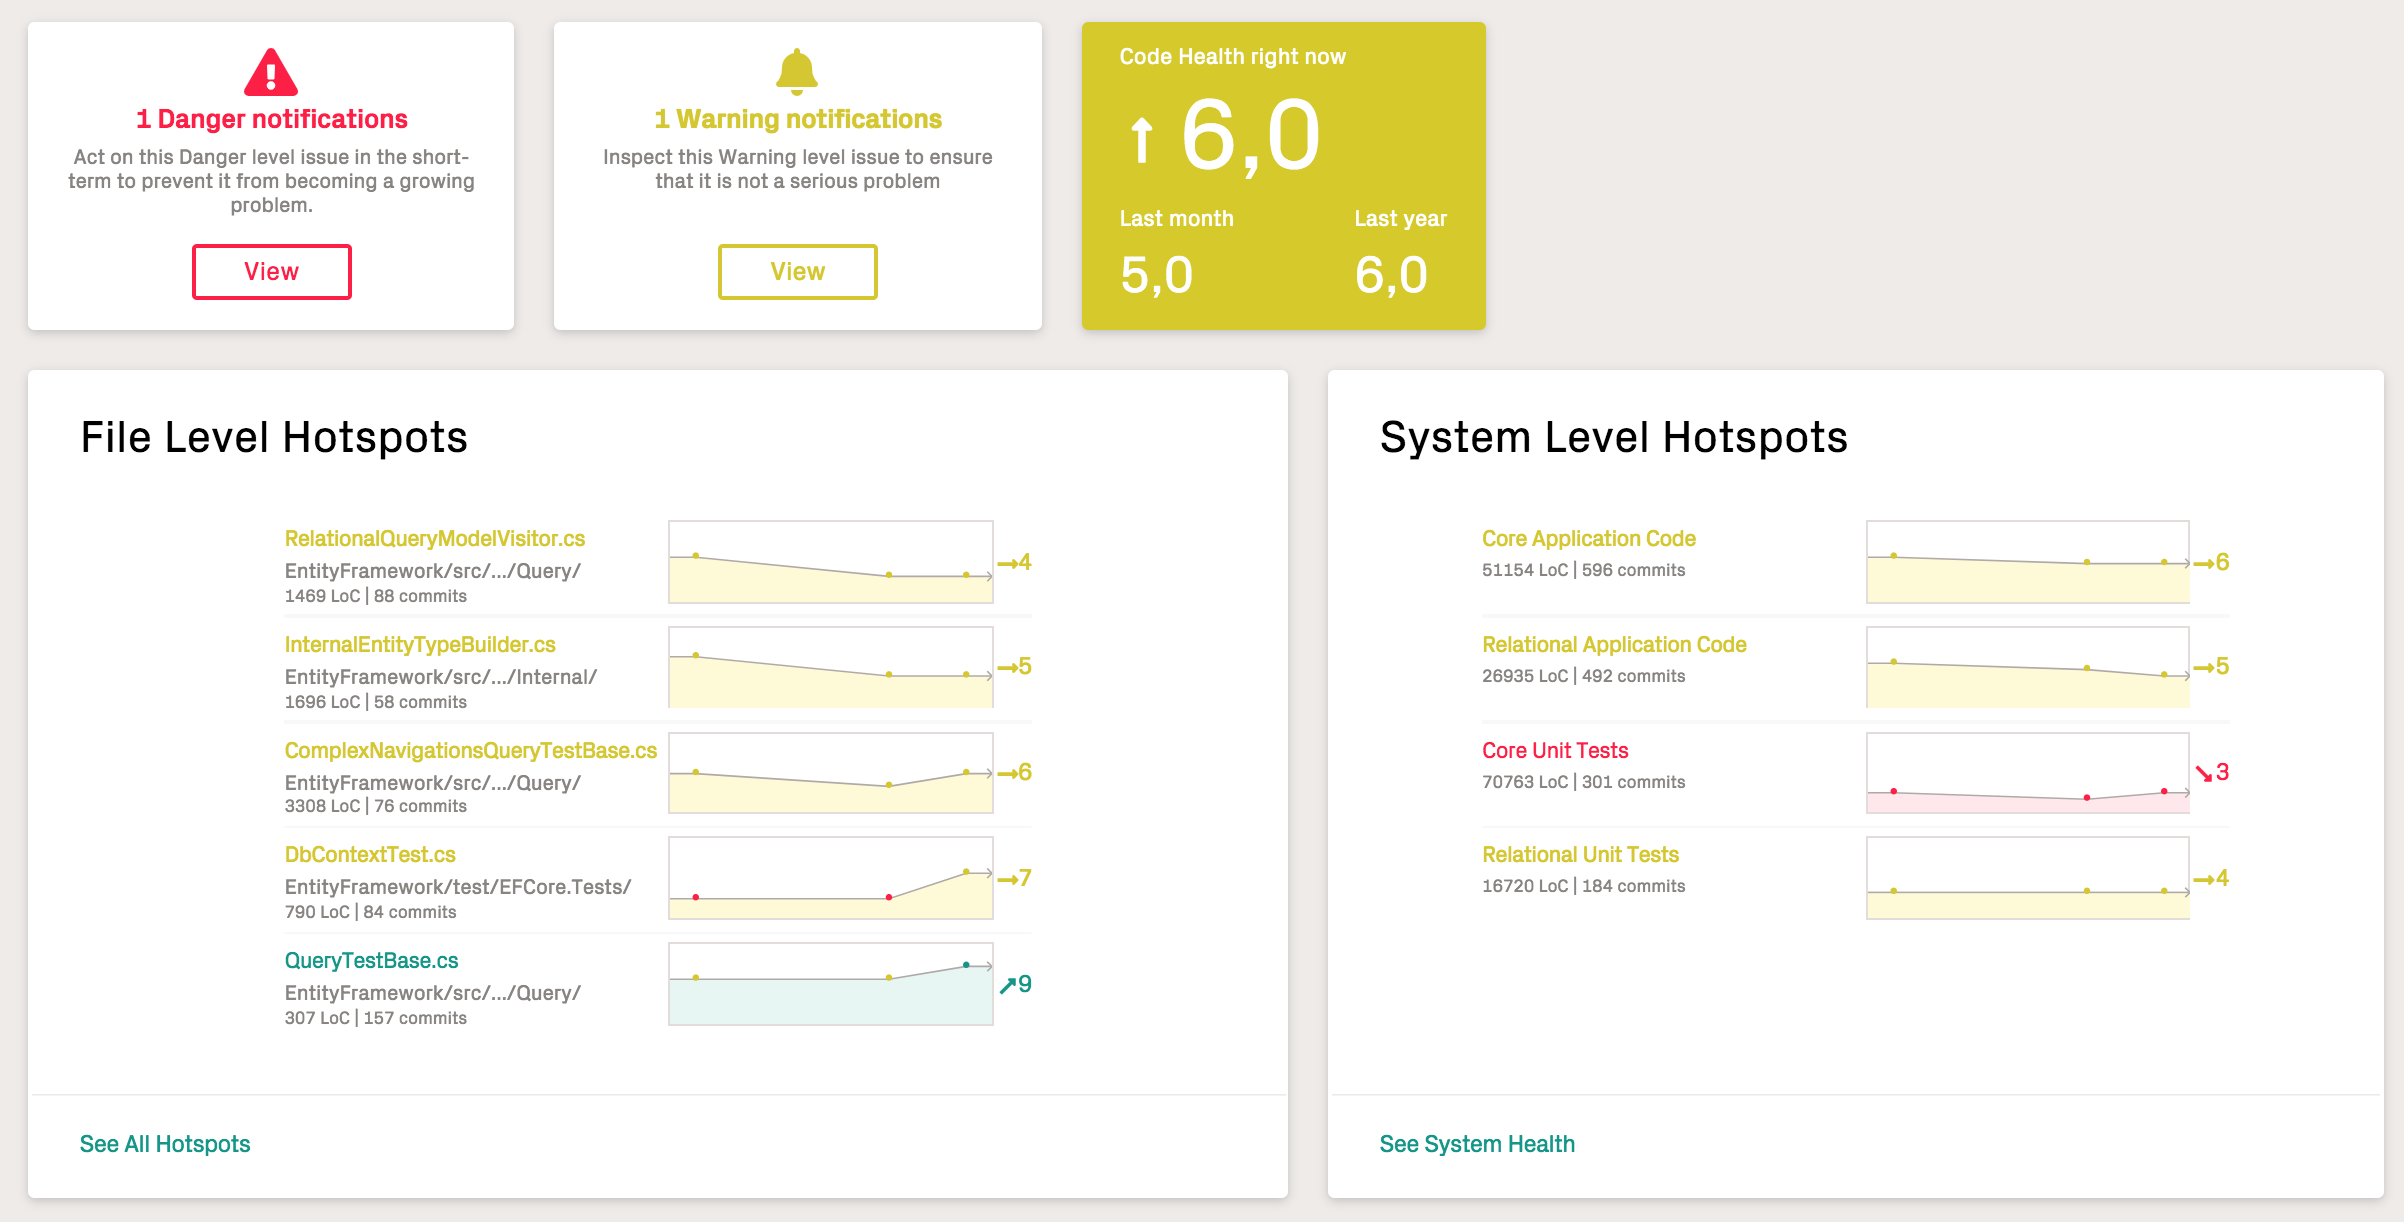
Fig. 81 Code Biomarkers summary on the analysis dashboard.
The Code Health scores on the dashboard show the (weighted) aggregation of the health of your prioritized hotspots. That is, the code that is most likely to drive the costs of new features and improvements. In this example, we see that a codebase that seems to degrade rapidly, going from a healthy score of 8 down to a low health of 4 in less than a year. That trend is a clear warning sign that the organization needs to invest more time into refactoring and code improvements.
Biomarkers Present Actionable Metrics
Before we move on, how do we know that the biomarkers and scores are relevant? Well, the biomarkers are built on top of CodeScene’s other metrics and behavioral data. That means we only score the prioritized parts of the codebase, the one’s that are most likely to impact development and maintenance costs as show in Fig. 82.
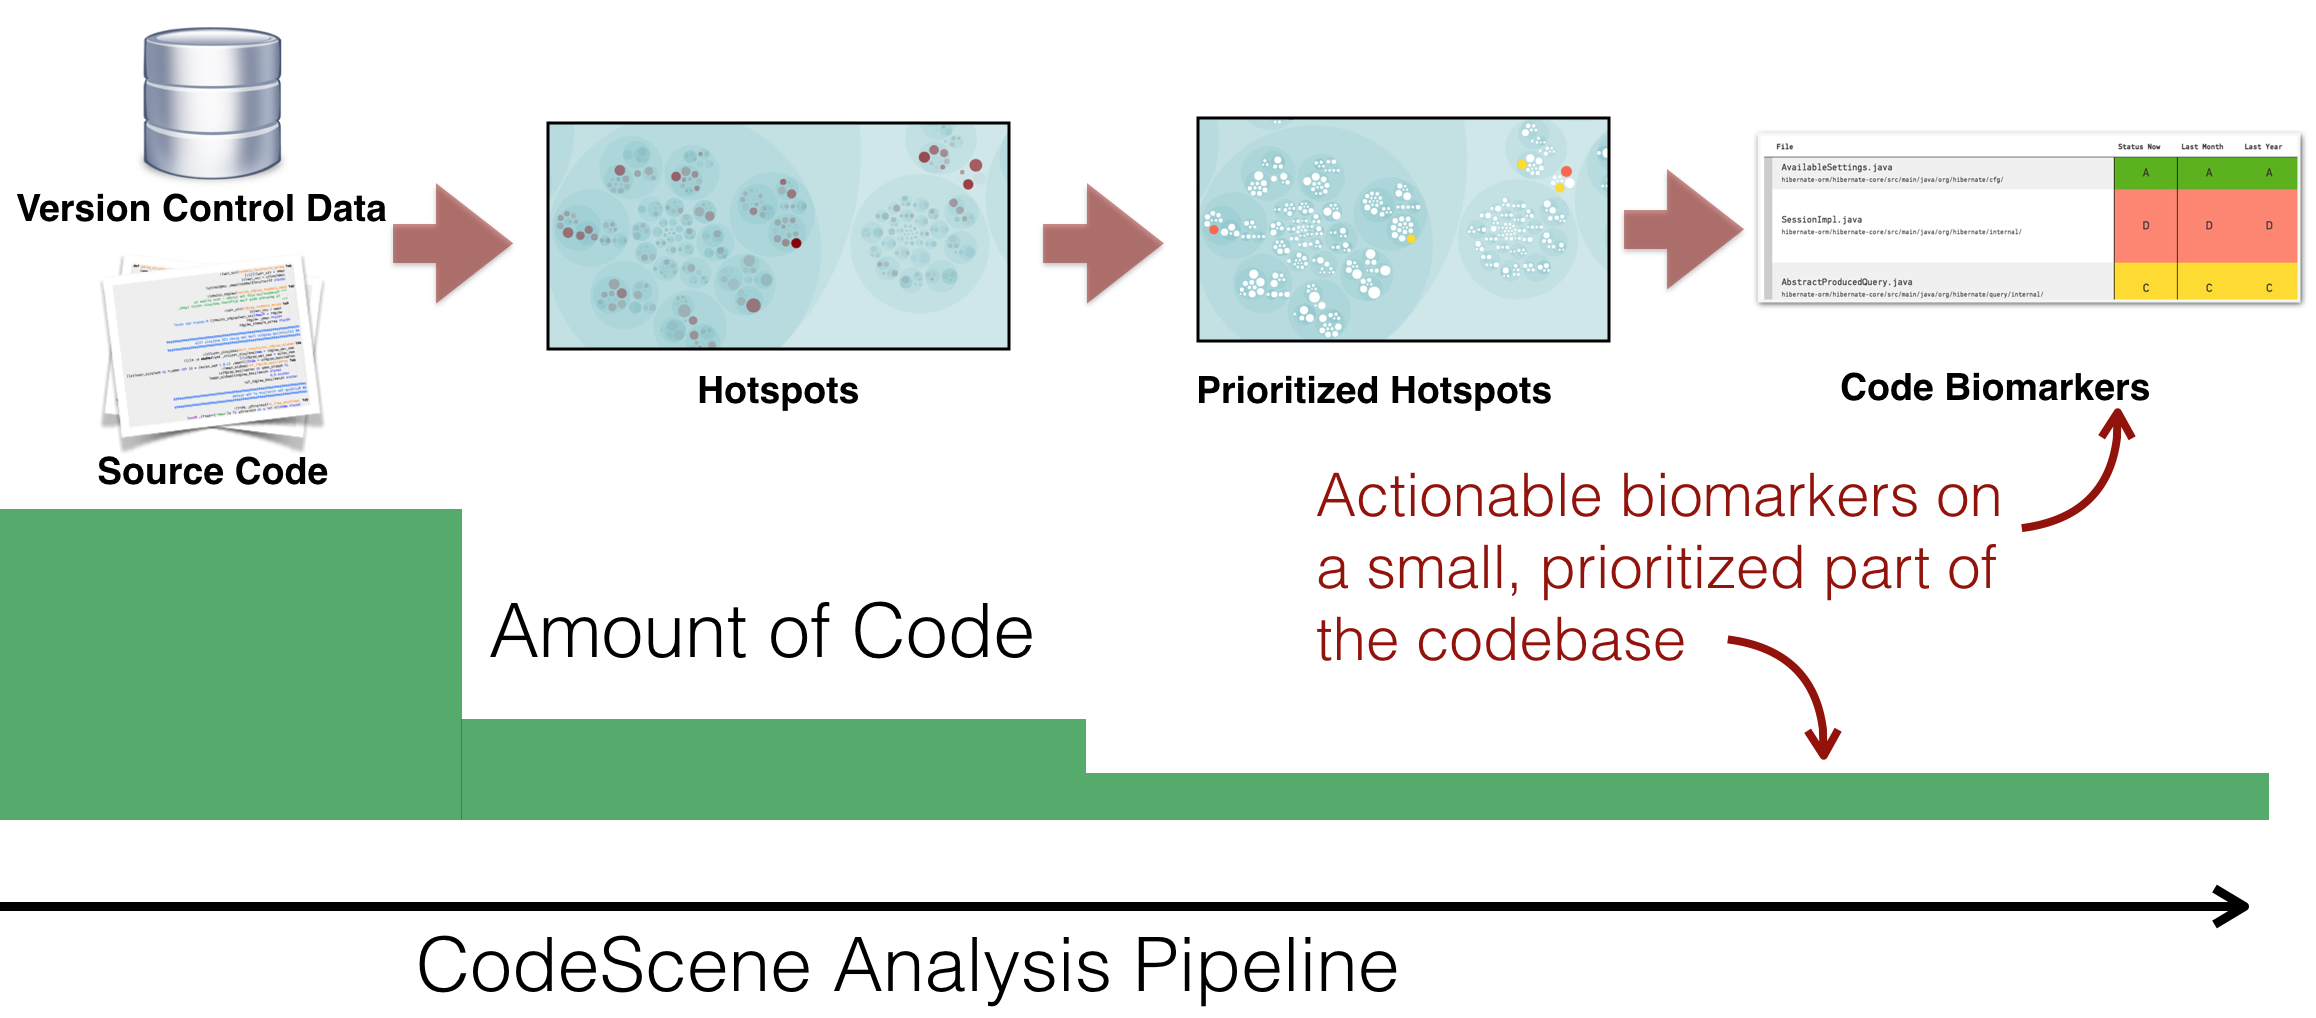
Fig. 82 Biomarkers are built on top of CodeScene’s prioritized hotspots.
Using this principle, Code Biomarkers fill a number of important gaps:
Bridge the gap between developers and non-technical stakeholders: The biomarkers visualization provides information to managers that help decide on when to take a step back, invest in technical improvements, and measure the effects.
Get immediate feedback on improvements: The biomarker trends gives you immediate and visual feedback on the investments you do in refactorings.
Share an objective picture of your code quality: The biomarker scores are based on baseline data from throusands of codebases, and your code is scored against an industry average of similar codebases.
Get suggestions on where to start refactorings: The code biomarkers hint at specific problems in each file, which also suggests which refactorings that could be used to address the findings.
Let’s demonstrate those properties by having a more detailed look at biomarkers in biomarkers-trend-example.
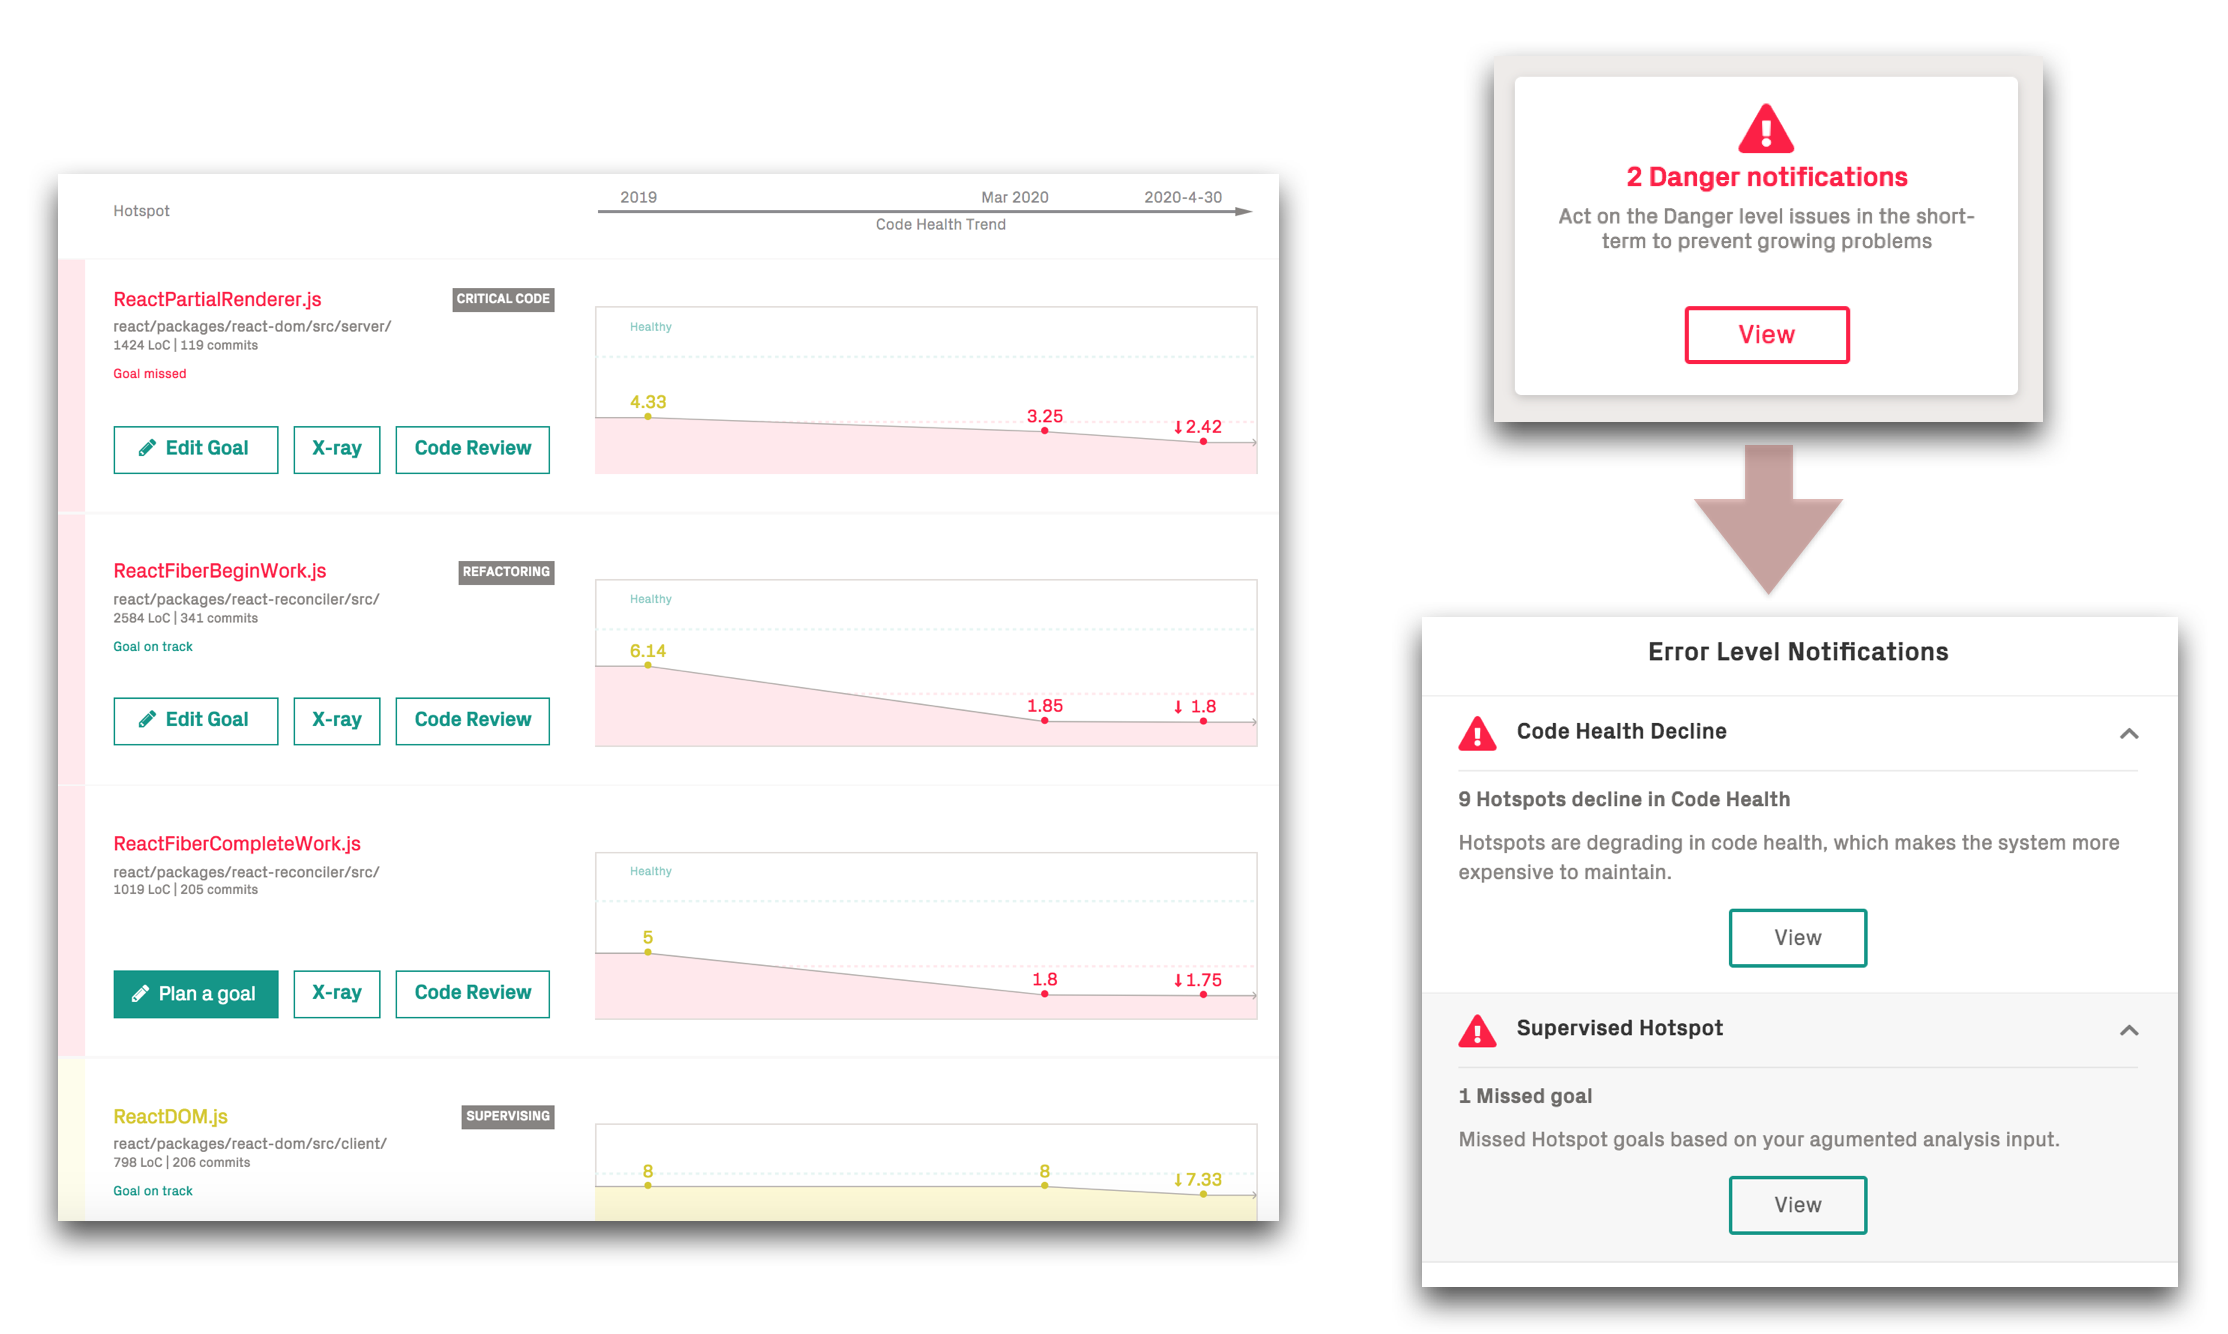
Fig. 83 Code Health Trends and Biomarkers for a specific project.
The biomarkers in biomarkers-trend-examplef provide detailed indications for each prioritized hotspot. We note that the top
hotspot, StageBuilder has declined in health over the past months. We also note the warning sign for DeltaHighlight.java, which
has degraded from a full 10 score to a medium health of 6.
Note that the organization has already planned a set of goals for the hotspots in Fig. 81 using CodeScene’s Intelligent Notes (see Manage Hotspots and Technical Debt with Goals). This is important as the goal oriented workflow that CodeScene encourages, lets you track and manage technical debt in the context of your decisions and plans. Make sure to read the tutorial in Hands On Behavioral Code Analysis: CodeScene Use Cases to ensure you get the most out of CodeScene.
Finally, we get more details when we request the virtual code review via the lab bottle next to each hotspot. Use the virtual code review as an initial step towards refactoring decaying hotspots.
Guide Refactorings via the High-Level Patterns Presented in the Virtual Code Reviewer
Often, hotspots with low code health will contain brain methods and be low on cohesion. This is an indication that the hotspot lacks modularity on both function and class level. The code biomarkers will detect this and inform you.
Follow up with an X-Ray in order to prioritize local improvements based on how likely those refactoring are to pay off.
Using X-Ray, we can also investigate the code duplication reported by a biomarker. Duplicated code usually hints at one–or more–missing abstractions that we could introduce. Hence, we recommend to run an X-Ray analysis on the file to get more insights now that we know what to look for. We show an example of a QueryTestBase.cs X-Ray in Fig. 84.
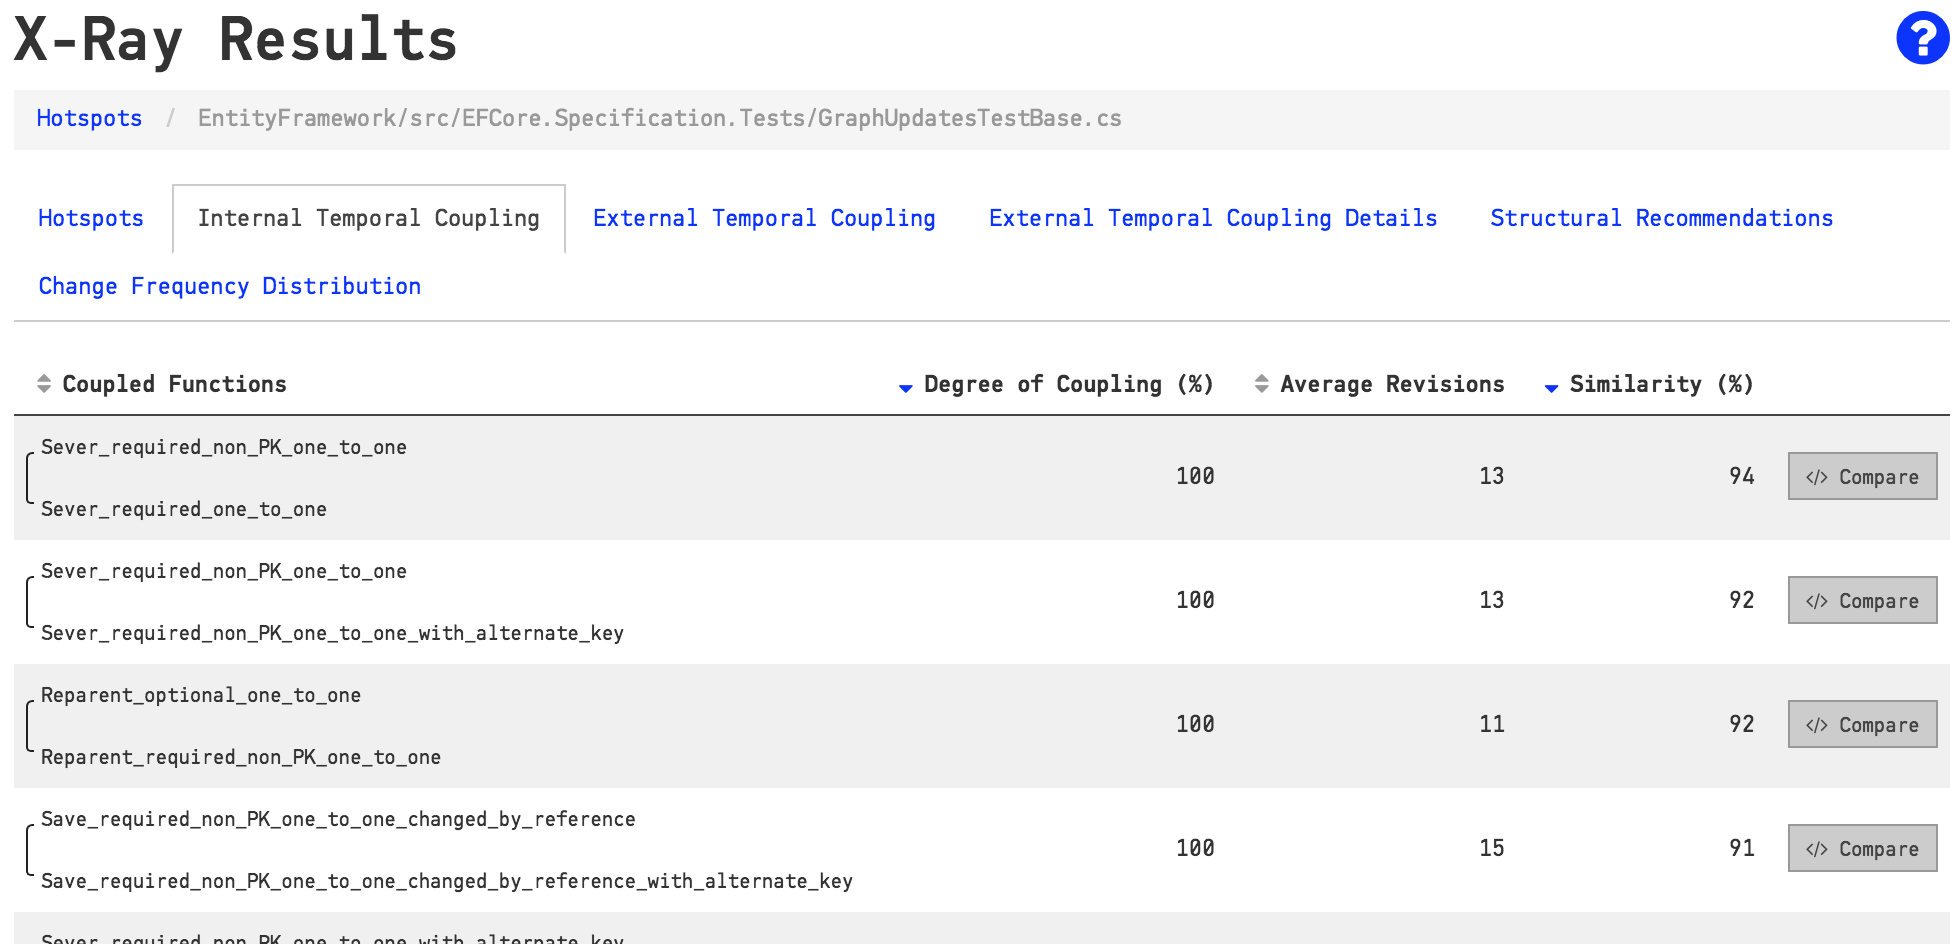
Fig. 84 Use X-Ray to follow-up on the biomarkers.
Launch the Virtual Code Reviewer to Get a Holistic View of Hotspots
You can launch a virtual code reviewer for any file. The virtual code review will aggregate the most significant metrics for your chosen file, as seen in Fig. 65.
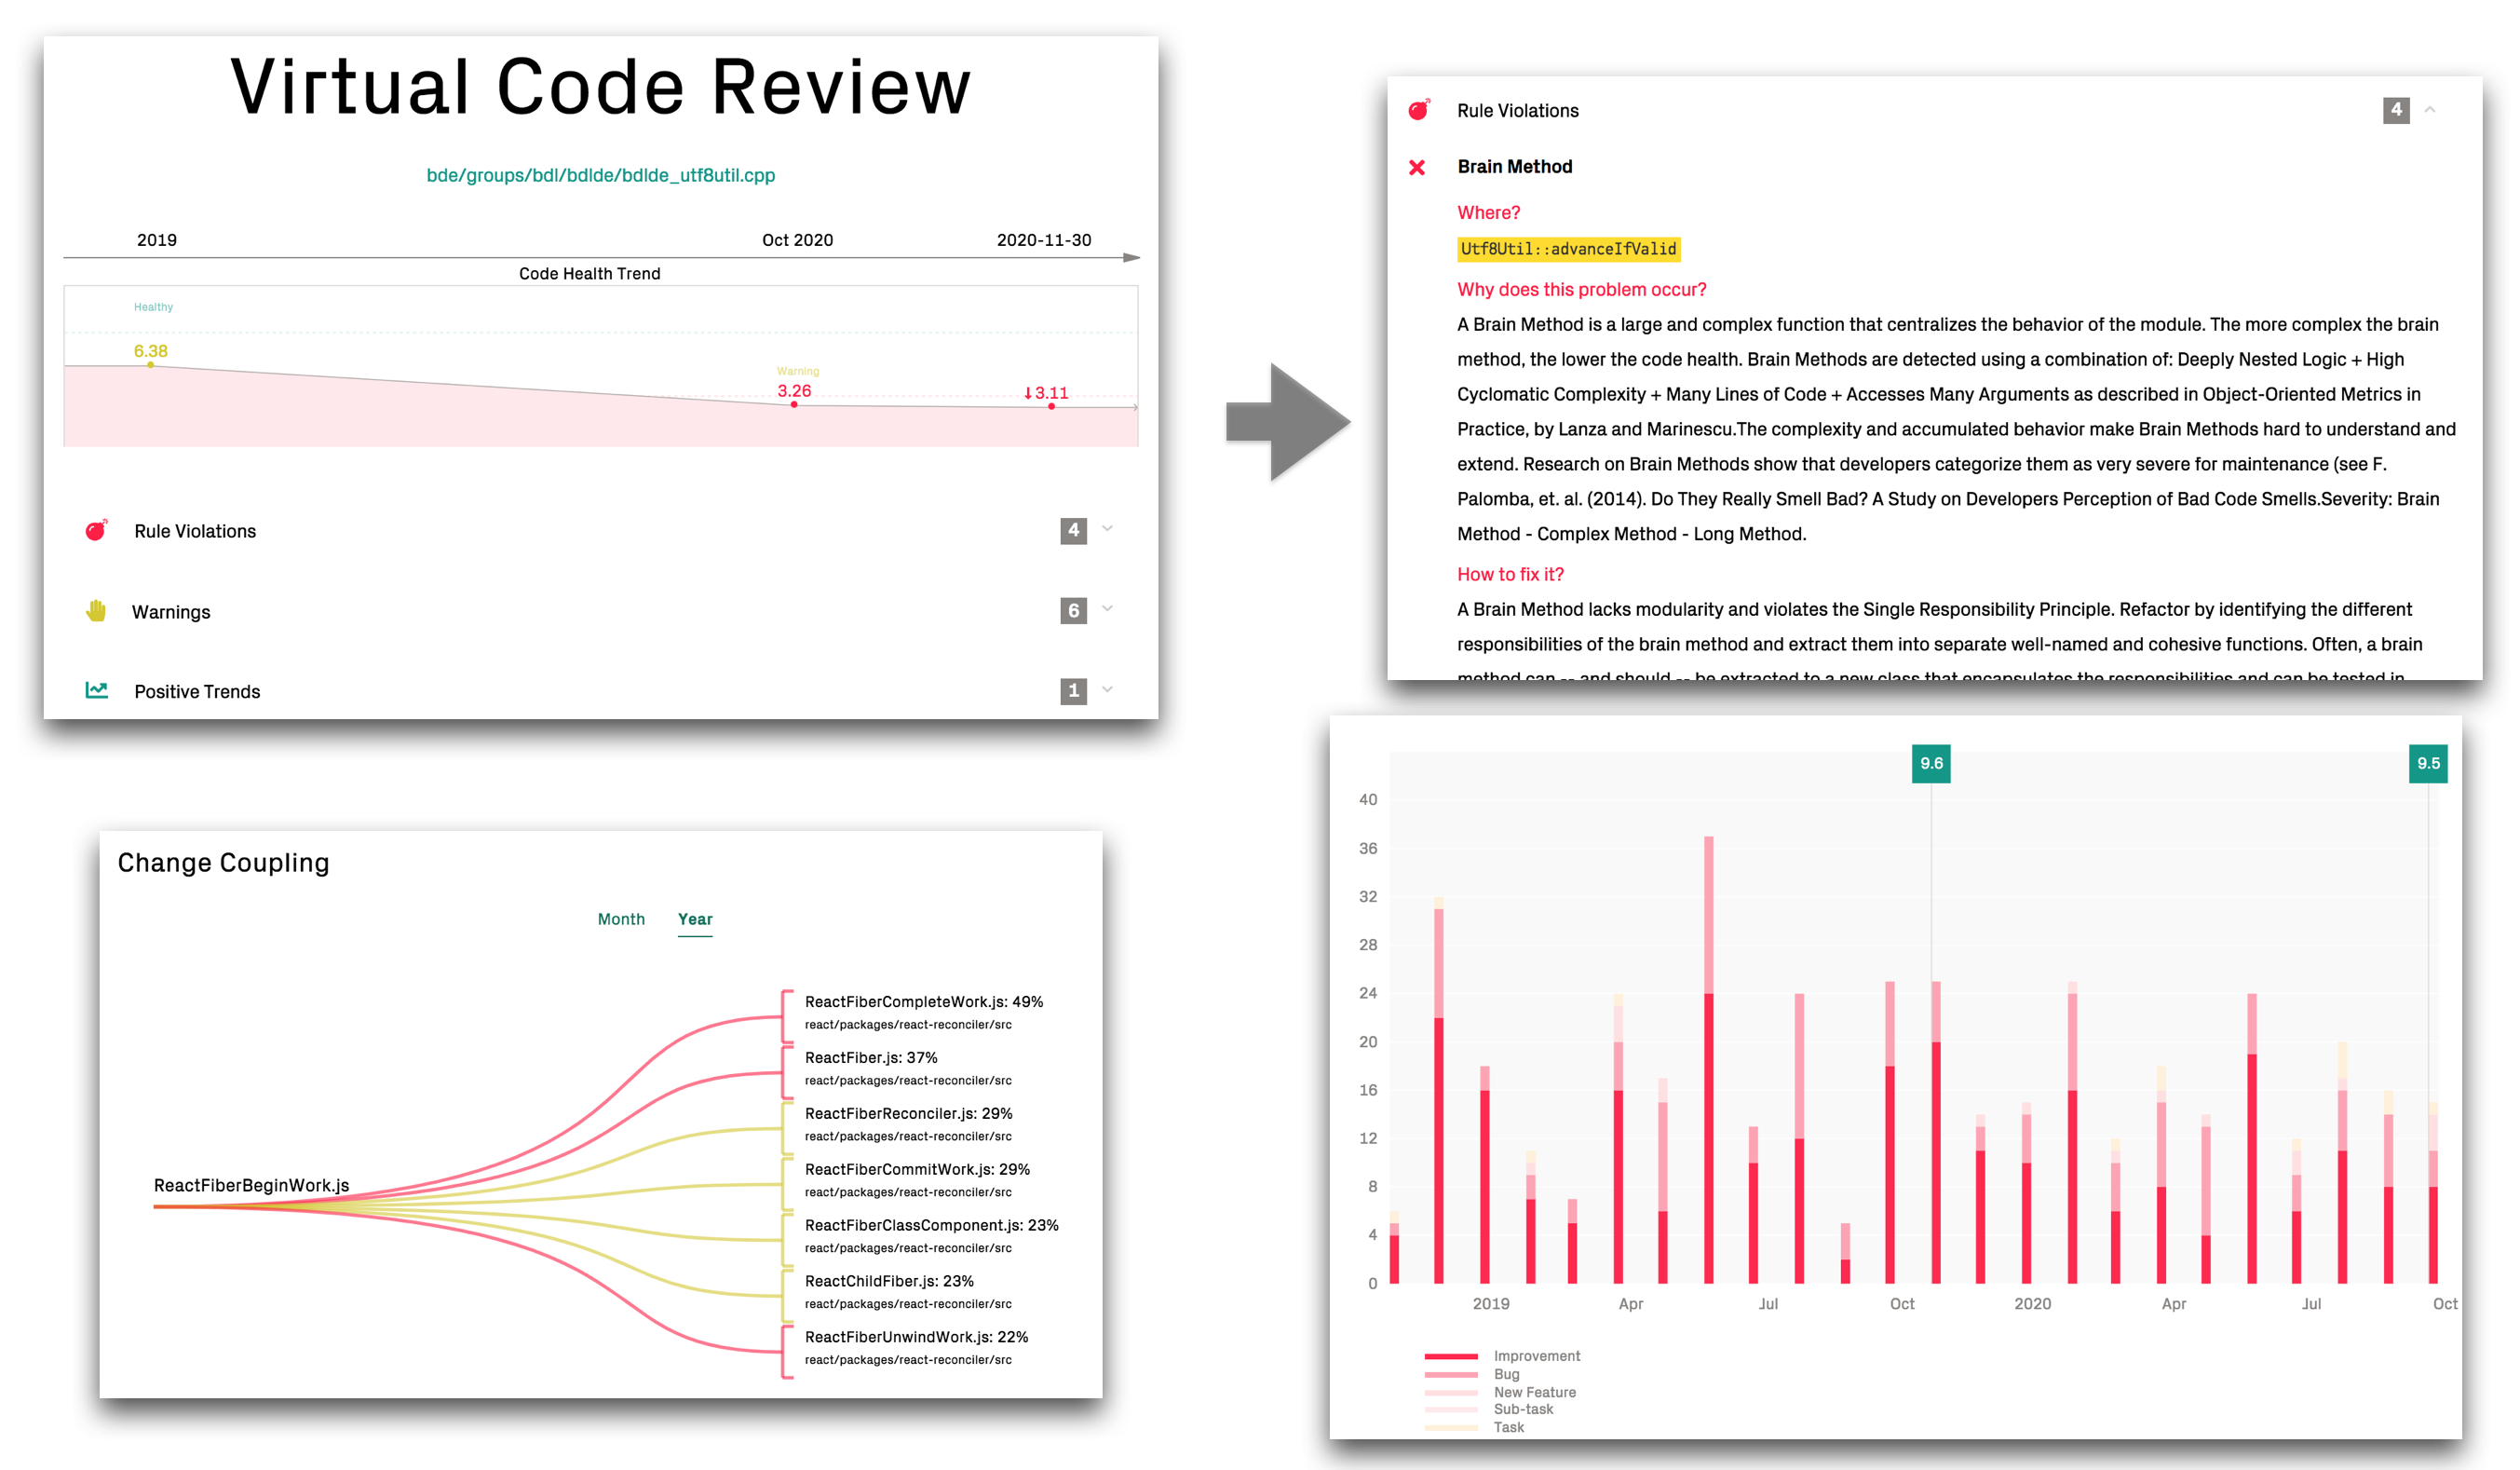
Fig. 85 Get a holistic overview of your hotspot.
The virtual code reviewer combines the social and technical analysis data you need to assess the severity of the biomarker findings:
Review the detailed biomarker indications to spot maintenance and quality issues.
Detect potential inter-team coordination bottlenecks that should drive refactorings through the social metrics such as the team autonomy measure.
See if it’s a growing problem in the Complexity Trend.
Investigate the change coupling, filtered for your selected file under review.
Use the defect trend to estimate the cost of any technical or social debt you might find in the review.
Augment Hotspots to let CodeScene Supervise them
Once you have inspected a hotspot you can augmented the analysis with your observations. An augmented analysis lets you categorize your findings so that CodeScene can supervise and guide you based on the technical debt you identify. This augmented analysis provides a complete framework for managing technical debt and is described in detail in Manage Hotspots and Technical Debt with Goals
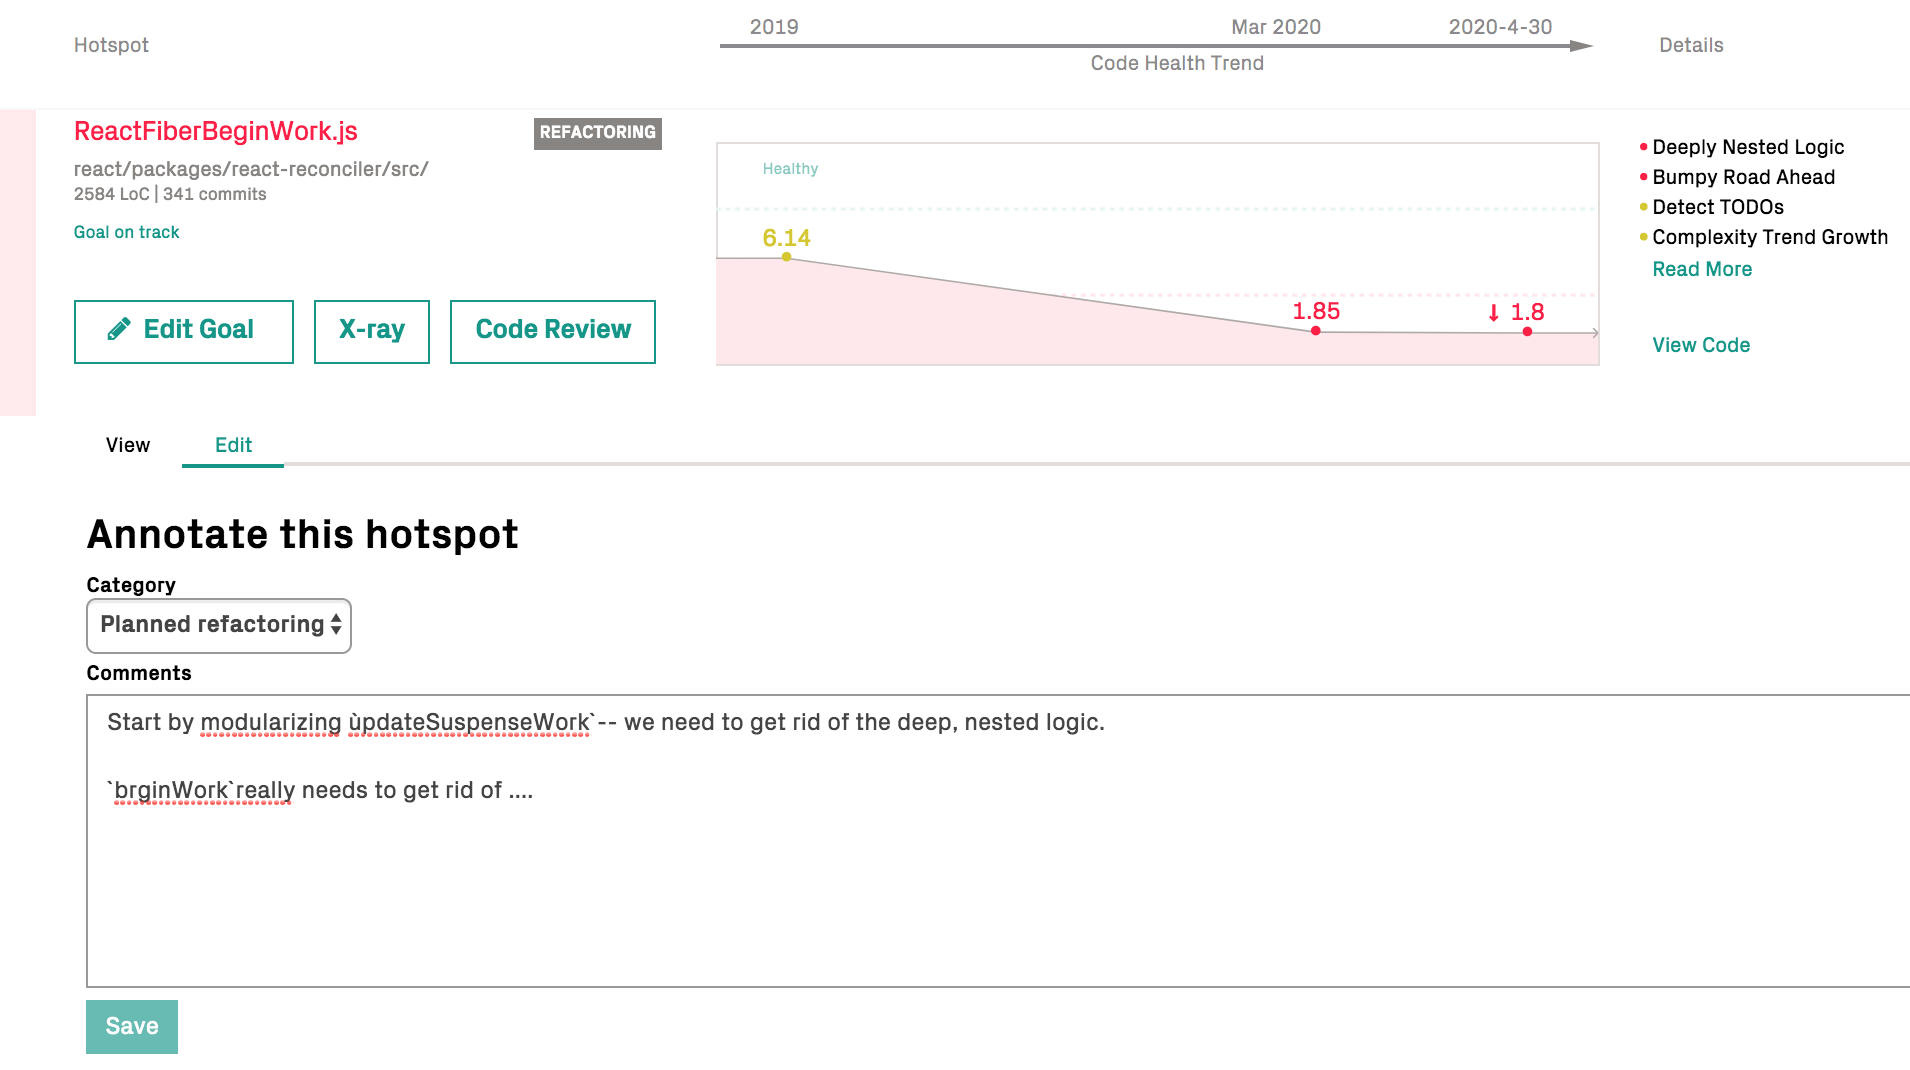
Fig. 86 Add a goal to any hotspot in the Code Health view.
Auto-Detect Declining Code Health with Continuous Integration
CodeScene’s delta analysis lets you supervise your code health as part of a continuous integration pipeline. This lets you auto-detect files that seem to degrade in quality through issues introduced in the current commit or pull request. See Use a Delta Analysis to Save Time in Code Reviews for more details.