Troubleshooting: Diagnostics, Errors, and Logs
We work hard to ensure that CodeScene just works. This means you point CodeScene to your codebase, press a button, and get the analysis results.
If you’re facing an unexpected issue or application behavior, you can use detailed analysis diagnostics and logs to gather more data and share them with Empear support.
Analysis Errors
On the rare occasion when an analysis fails, we make sure you know about it so that you can take corrective actions.
On the main landing page, CodeScene displays two kinds of notifications:
The first notifications, with the triangular warning sign, are not for troubleshooting CodeScene. They concern the codebases being analyzed: CodeScene has detected something that requires your attention. It’s time to check the analysis dashboard.
The second kind indicate that there was a problem when running the analysis.
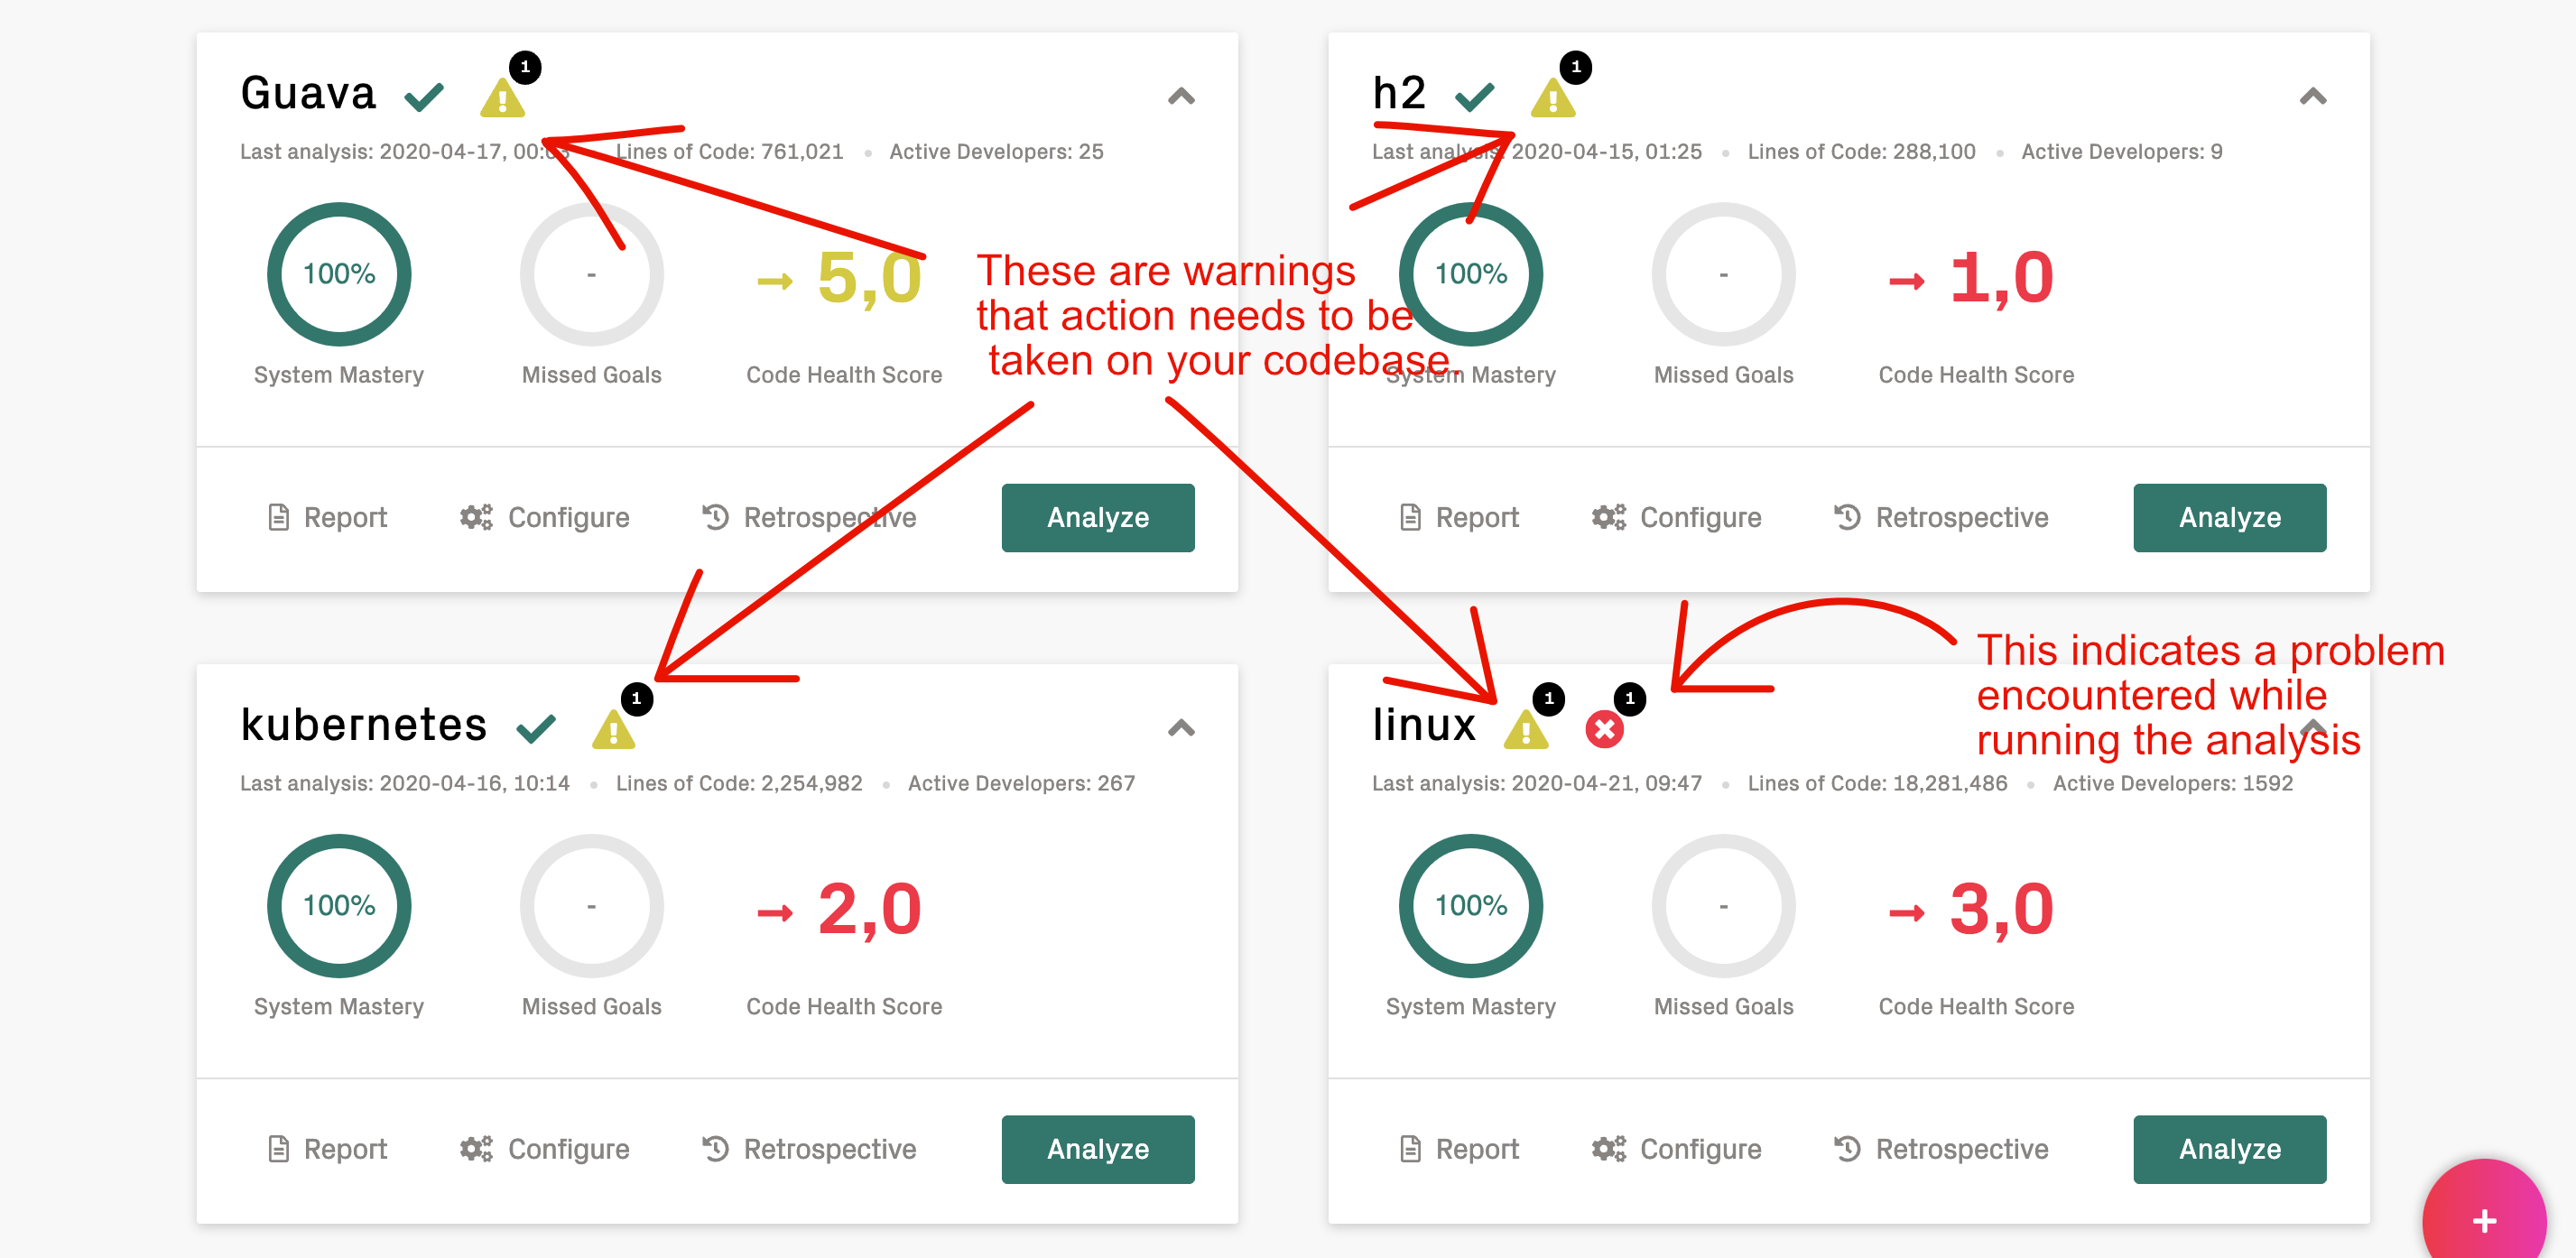
Fig. 16 There are two kinds of notifications on the main landing page.
When you click on the analysis error icon, you can see what the problem or problems are.
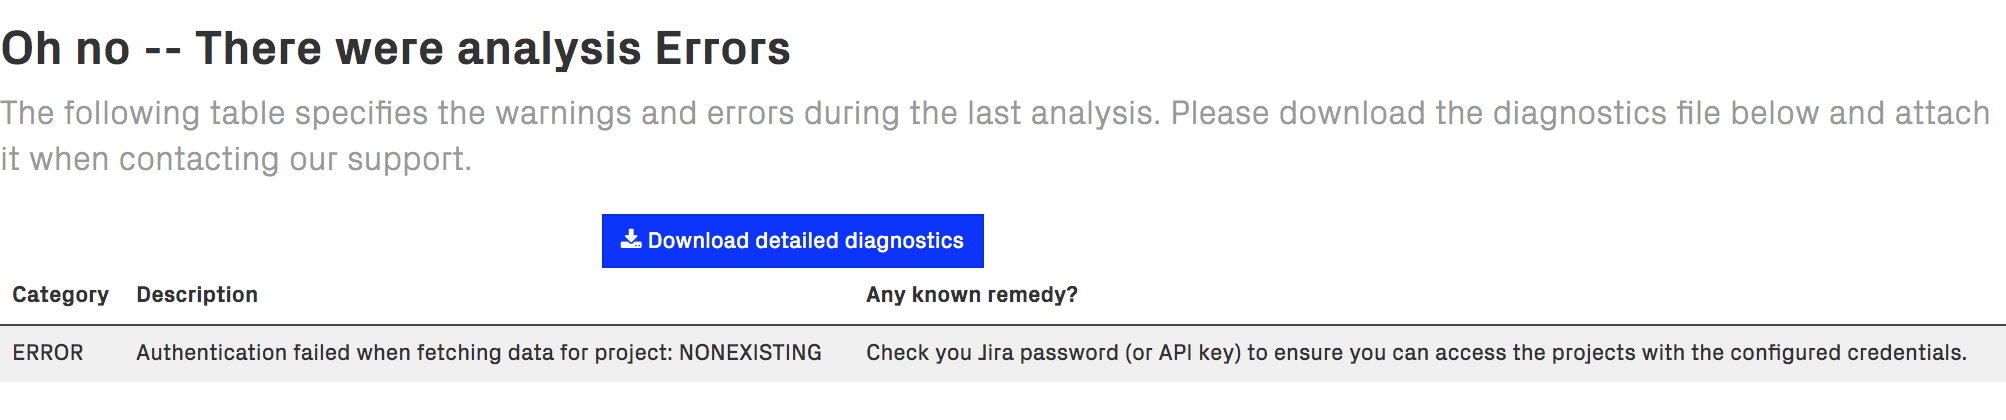
Fig. 17 Click on the warning and error icons to retrieve the detailed diagnostics.
We distinguish between errors and warnings during an analysis:
Errors: An analysis error means that we couldn’t complete the analysis since we didn’t manage to fetch all the data we need. This is often due to an external data source that isn’t available. Examples include 3rd party integrations such as Jira.
Warnings: A warning means that the analysis completed but we did identify some conditions that requires your attention. A common example is that the Git repositories couldn’t be updated, which means that your latest code changes might not be reflected in the analysis. Another example might be parser errors when scanning the source code.
We do our best to keep the error messages informative. Please get in touch with our support if an error message or remedy isn’t clear – we consider error messages that are hard to understand an internal error, and love the opportunity to improve them. Click on Download detailed diagnostics to retrieve a file that can be shared with Empear for further inspection.
Logs
CodeScene logs contain important clues about errors and the application behavior and it’s always a good idea to attach them to your support requests.
Log levels
The default log level CodeScene uses is INFO.
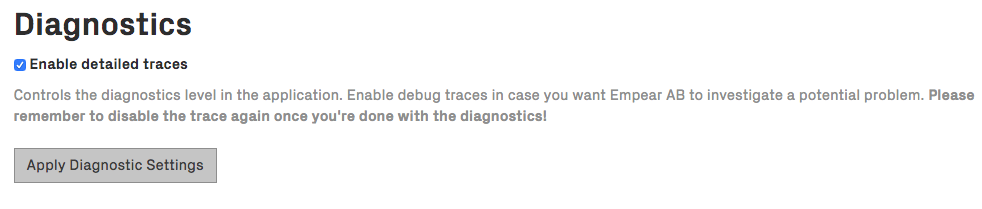
To enable more detailed logging you have two options:
Set
CODESCENE_LOG_LEVELenvironment variable: supported levels are ERROR, WARN, INFO, DEBUG, TRACE. INFO is a good default level but make sure to check the volume of logs CodeScene generates. This setting requires a restart.Check Enable detailed traces in Configuration -> System, as shown in the next figure. Note that this sets log level to TRACE which is very verbose. It’s useful for a temporary debugging session. This setting doesn’t surive a restart.
Where can I find the logs?
CodeScene logs to standard output.
The way you retrieve logs depends on how you run it:
Standalone JAR: standard output - you may want to redirect it to a file.
Docker container: retrieve logs via the
docker logscommand.Tomcat: logs are stored in the
<TOMCAT_HOME>/logs/directory. There’s usually a single big catalina.out file which contains aggregated logs from the beginning or a particular point in time (after you cleared the log). There are also many localhost.YYYY-MM-DD.log files which can contain other useful information, especially about deployment-time errors.
PR Integration error when runing CodeScene with docker-compose
While setting up the PR Integration for your project, on rare ocasions CodeScene might fail with exception:
sun.security.validator.ValidatorException: PKIX path building failed:
sun.security.provider.certpath.SunCertPathBuilderException:
unable to find valid certification path to requested target
In most cases, this happens because the certificate provided by the host URL is self-signed or one of the chain certificate is not trusted. The workaround is to create a local trust store and import the host URL certificate and the CA chain following the guide below:
Get the certificate from the host URL:
openssl s_client -showcerts -connect myhost.com:443 < /dev/null | openssl x509 -outform pem > mycertificate.pem
Make a folder to save the store:
mkdir store
Create the keystore (you will be asked to set a password, also answer yes when asked to trust the certificate):
keytool -import -alias mykey -keystore store/mytruststore.ks -file mycertificate.pem
Import the java cacerts. For Mac OSX, the source password is empty (just press enter), the destination password is the one set on step 3; for other operating systems, you should adapt the srckeystore path value.
keytool -importkeystore -srckeystore $(/usr/libexec/java_home)/lib/security/cacerts -destkeystore store/mytruststore.ks
You should now have a truststore in:
store/mytruststore.ks:Edit
docker-compose.ymland addJAVA_OPTIONSand the volume containing the store (replaceyourpasswith the password set in step 3).
environment:
    ...
    - JAVA_OPTIONS=-Djavax.net.ssl.trustStore=/store/mytruststore.ks -Djavax.net.ssl.trustStorePassword=yourpass
    ...
volumes:
    ...
    - ./store:/store
    ...