Troubleshooting: Diagnostics, Errors, and Logs
We work hard to ensure that CodeScene just works. This means you point CodeScene to your codebase, press a button, and get the analysis results.
If you’re facing an unexpected issue or application behavior you can use detailed analysis diagnostics and logs to gather more data and share them with Empear support.
Analysis Errors
On the rare occasion when an analysis fails, we make sure you know about it so that you can take corrective actions.
On the main landing page, CodeScene displays two kinds of notifications:
- The first notifications, with the triangular warning sign, are not for troubleshooting CodeScene. They concern the codebases being analyzed: CodeScene has detected something that requires your attention. It’s time to check the analysis dashboard.
- The second kind indicate that there was a problem when running the analysis.
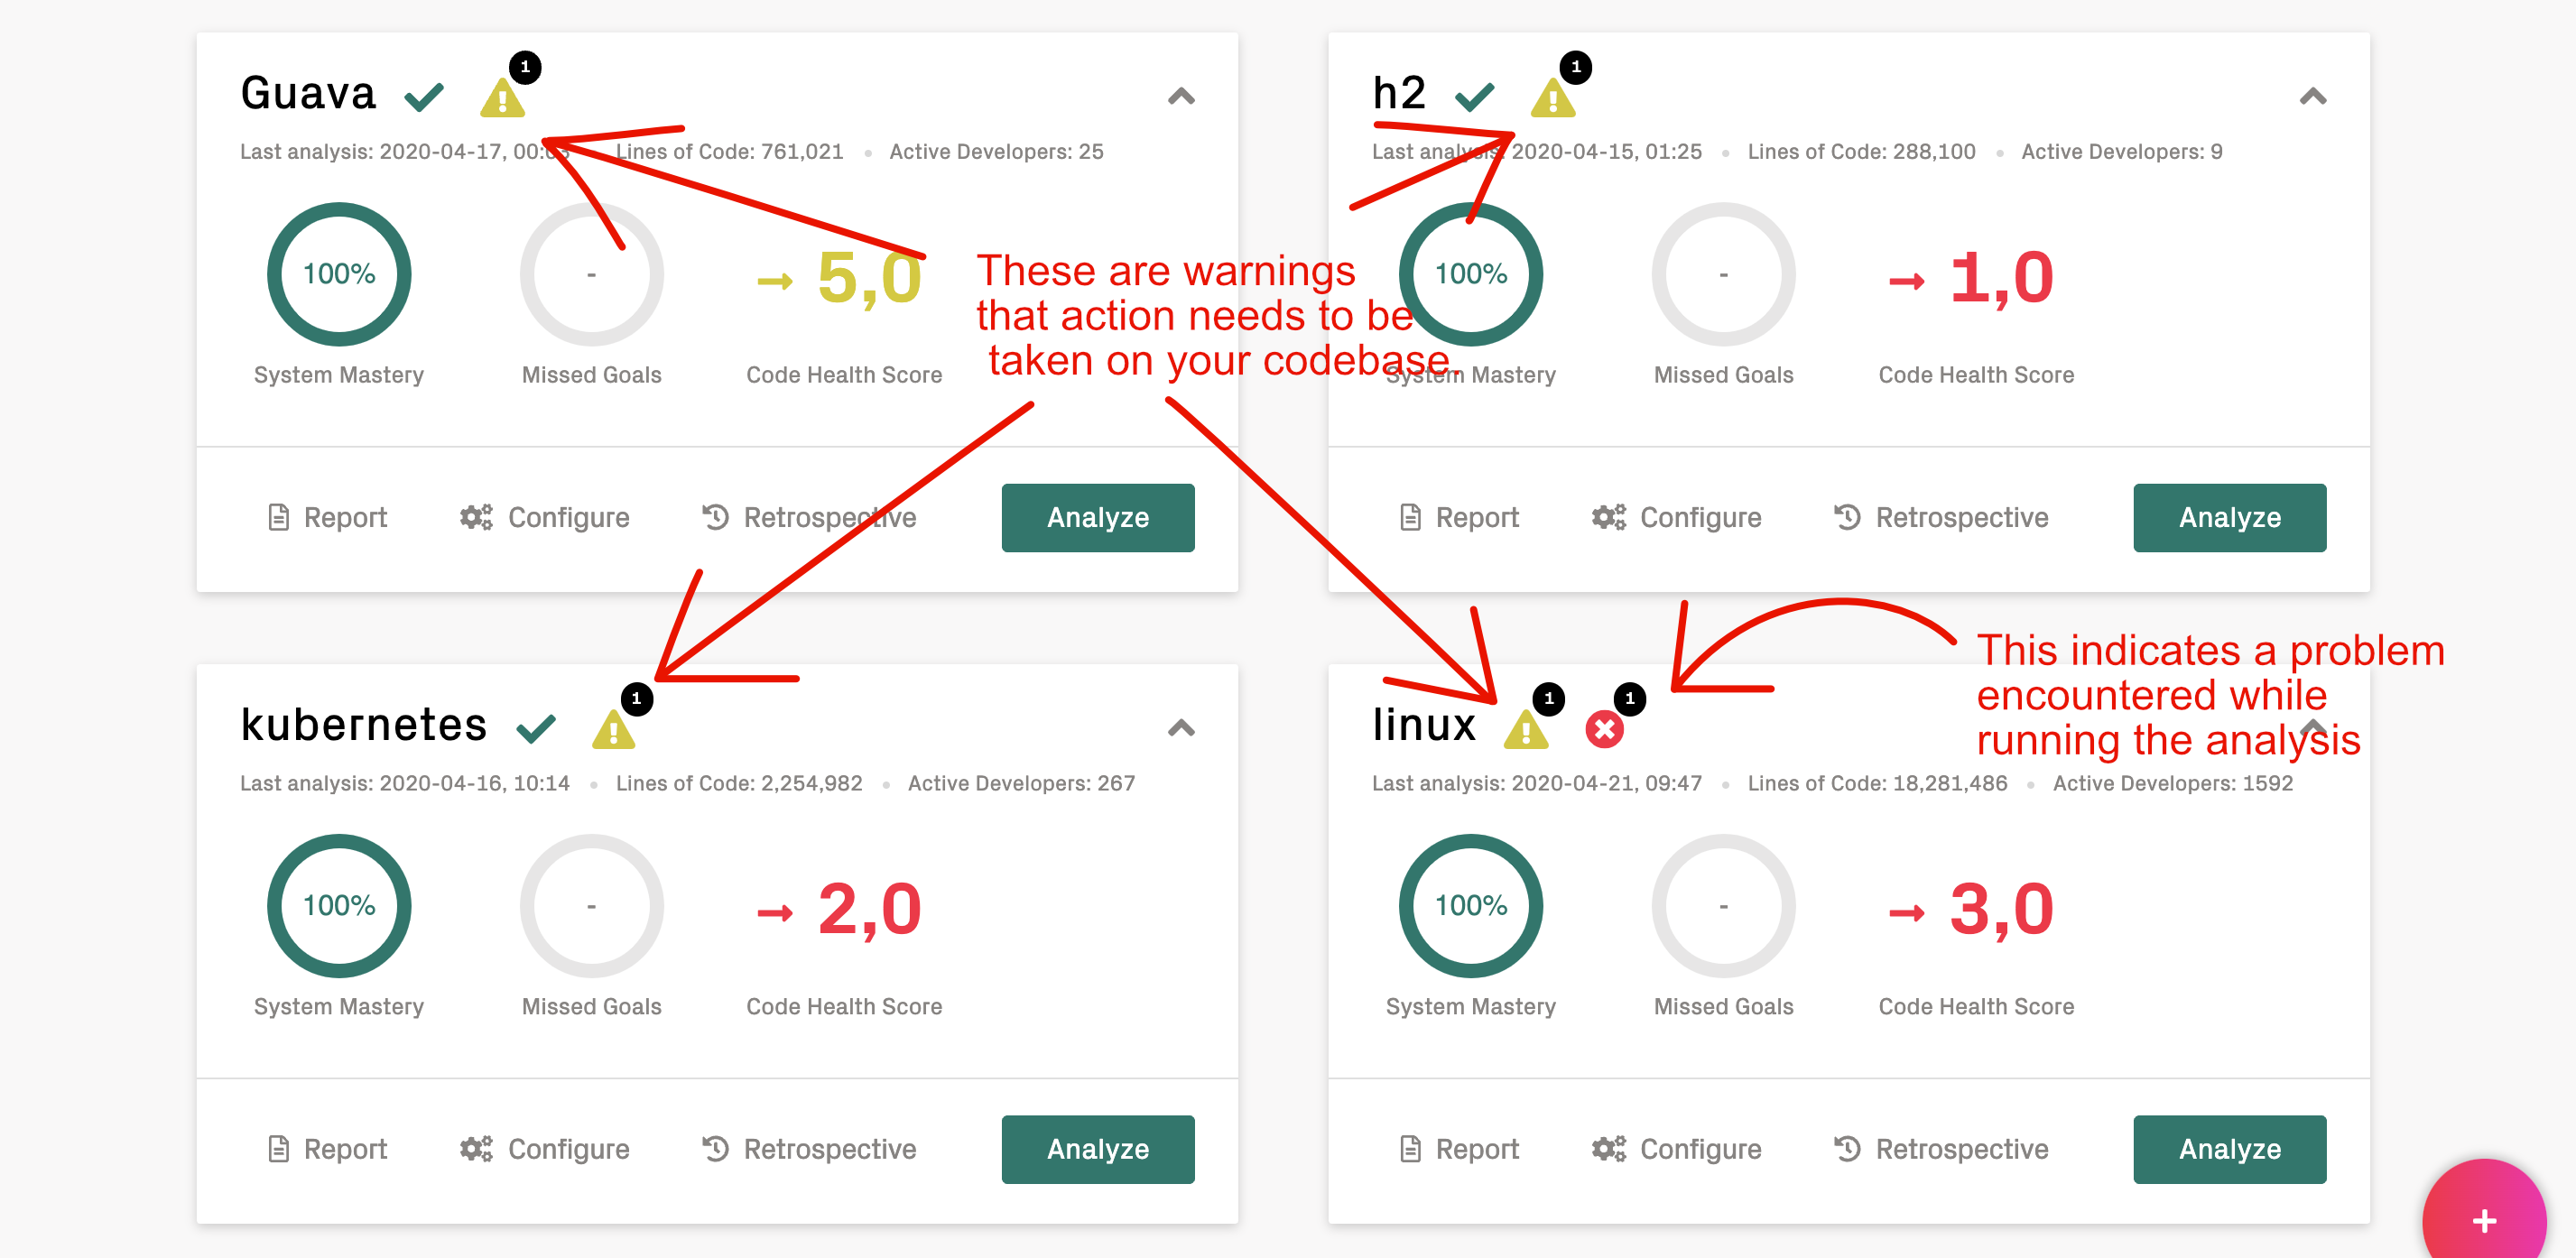
Fig. 13 There are two kinds of notifications on the main landing page.
When you click on the analysis error icon, you can see what the problem or problems are.
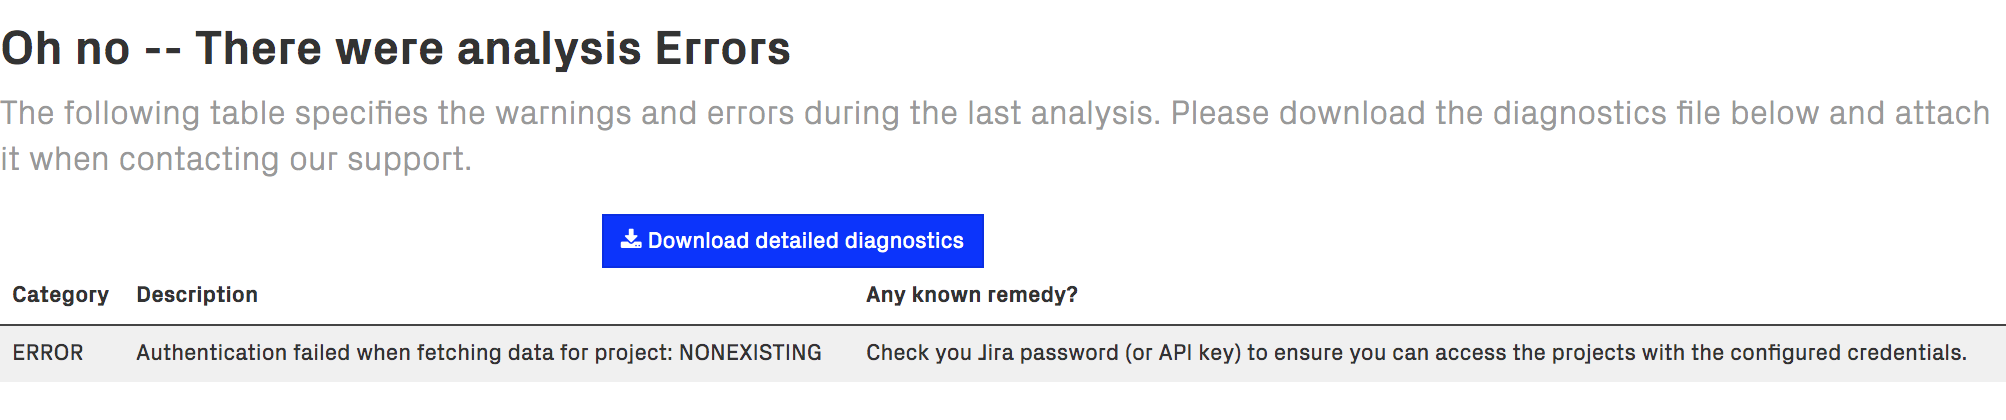
Fig. 14 Click on the warning and error icons to retrieve the detailed diagnostics.
We distinguish between errors and warnings during an analysis:
- Errors: An analysis error means that we couldn’t complete the analysis since we didn’t manage to fetch all the data we need. This is often due to an external data source that isn’t available. Examples include 3rd party integrations such as Jira.
- Warnings: A warning means that the analysis completed but we did identify some conditions that requires your attention. A common example is that the Git repositories couldn’t be updated, which means that your latest code changes might not be reflected in the analysis. Another example might be parser errors when scanning the source code.
We do our best to keep the error messages informative. Please get in touch with our support if an error message or remedy isn’t clear – we consider error messages that are hard to understand an internal error, and love the opportunity to improve them. Click on Download detailed diagnostics to retrieve a file that can be shared with Empear for further inspection.
Logs
CodeScene logs contain important clues about errors and the application behavior and it’s always a good idea to attach them to your support requests.
Log levels
The default log level is ERROR.
To enable more detailed logging you have two options:
- Set
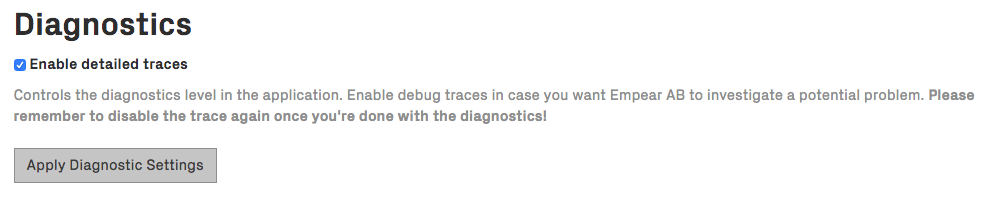
CODESCENE_LOG_LEVELenvironment variable: supported levels are ERROR, WARN, INFO, DEBUG, TRACE. A good default level is INFO (but make sure to check the volume of logs CodeScene generates). This setting requires a restart. - Check Enable detailed traces in Configuration -> System, as shown in the next figure. Note that this sets log level to TRACE which is very verbose. It’s useful for a temporary debugging session. This setting doesn’t surive a restart.
Where can I find the logs?
CodeScene logs to standard output.
The way you retrieve logs depends on how you run it:
- Standalone JAR: standard output - you may want to redirect it to a file.
- Docker container: retrieve logs via the
docker logscommand. - Tomcat: logs are stored in the
<TOMCAT_HOME>/logs/directory. There’s usually a single big catalina.out file which contains aggregated logs from the beginning or a particular point in time (after you cleared the log). There are also many localhost.YYYY-MM-DD.log files which can contain other useful information, especially about deployment-time errors.