Measure Delivery Performance with Business Metrics
Software development productivity is notoriously hard to measure. At the same time, it’s important to visualize the business impact of any technical debt that CodeScene detects or to measure the effects of changed ways of working in a business context. For that purpose, CodeScene includes a Delivery Performance module that adds business metrics on top of our engineering metrics.
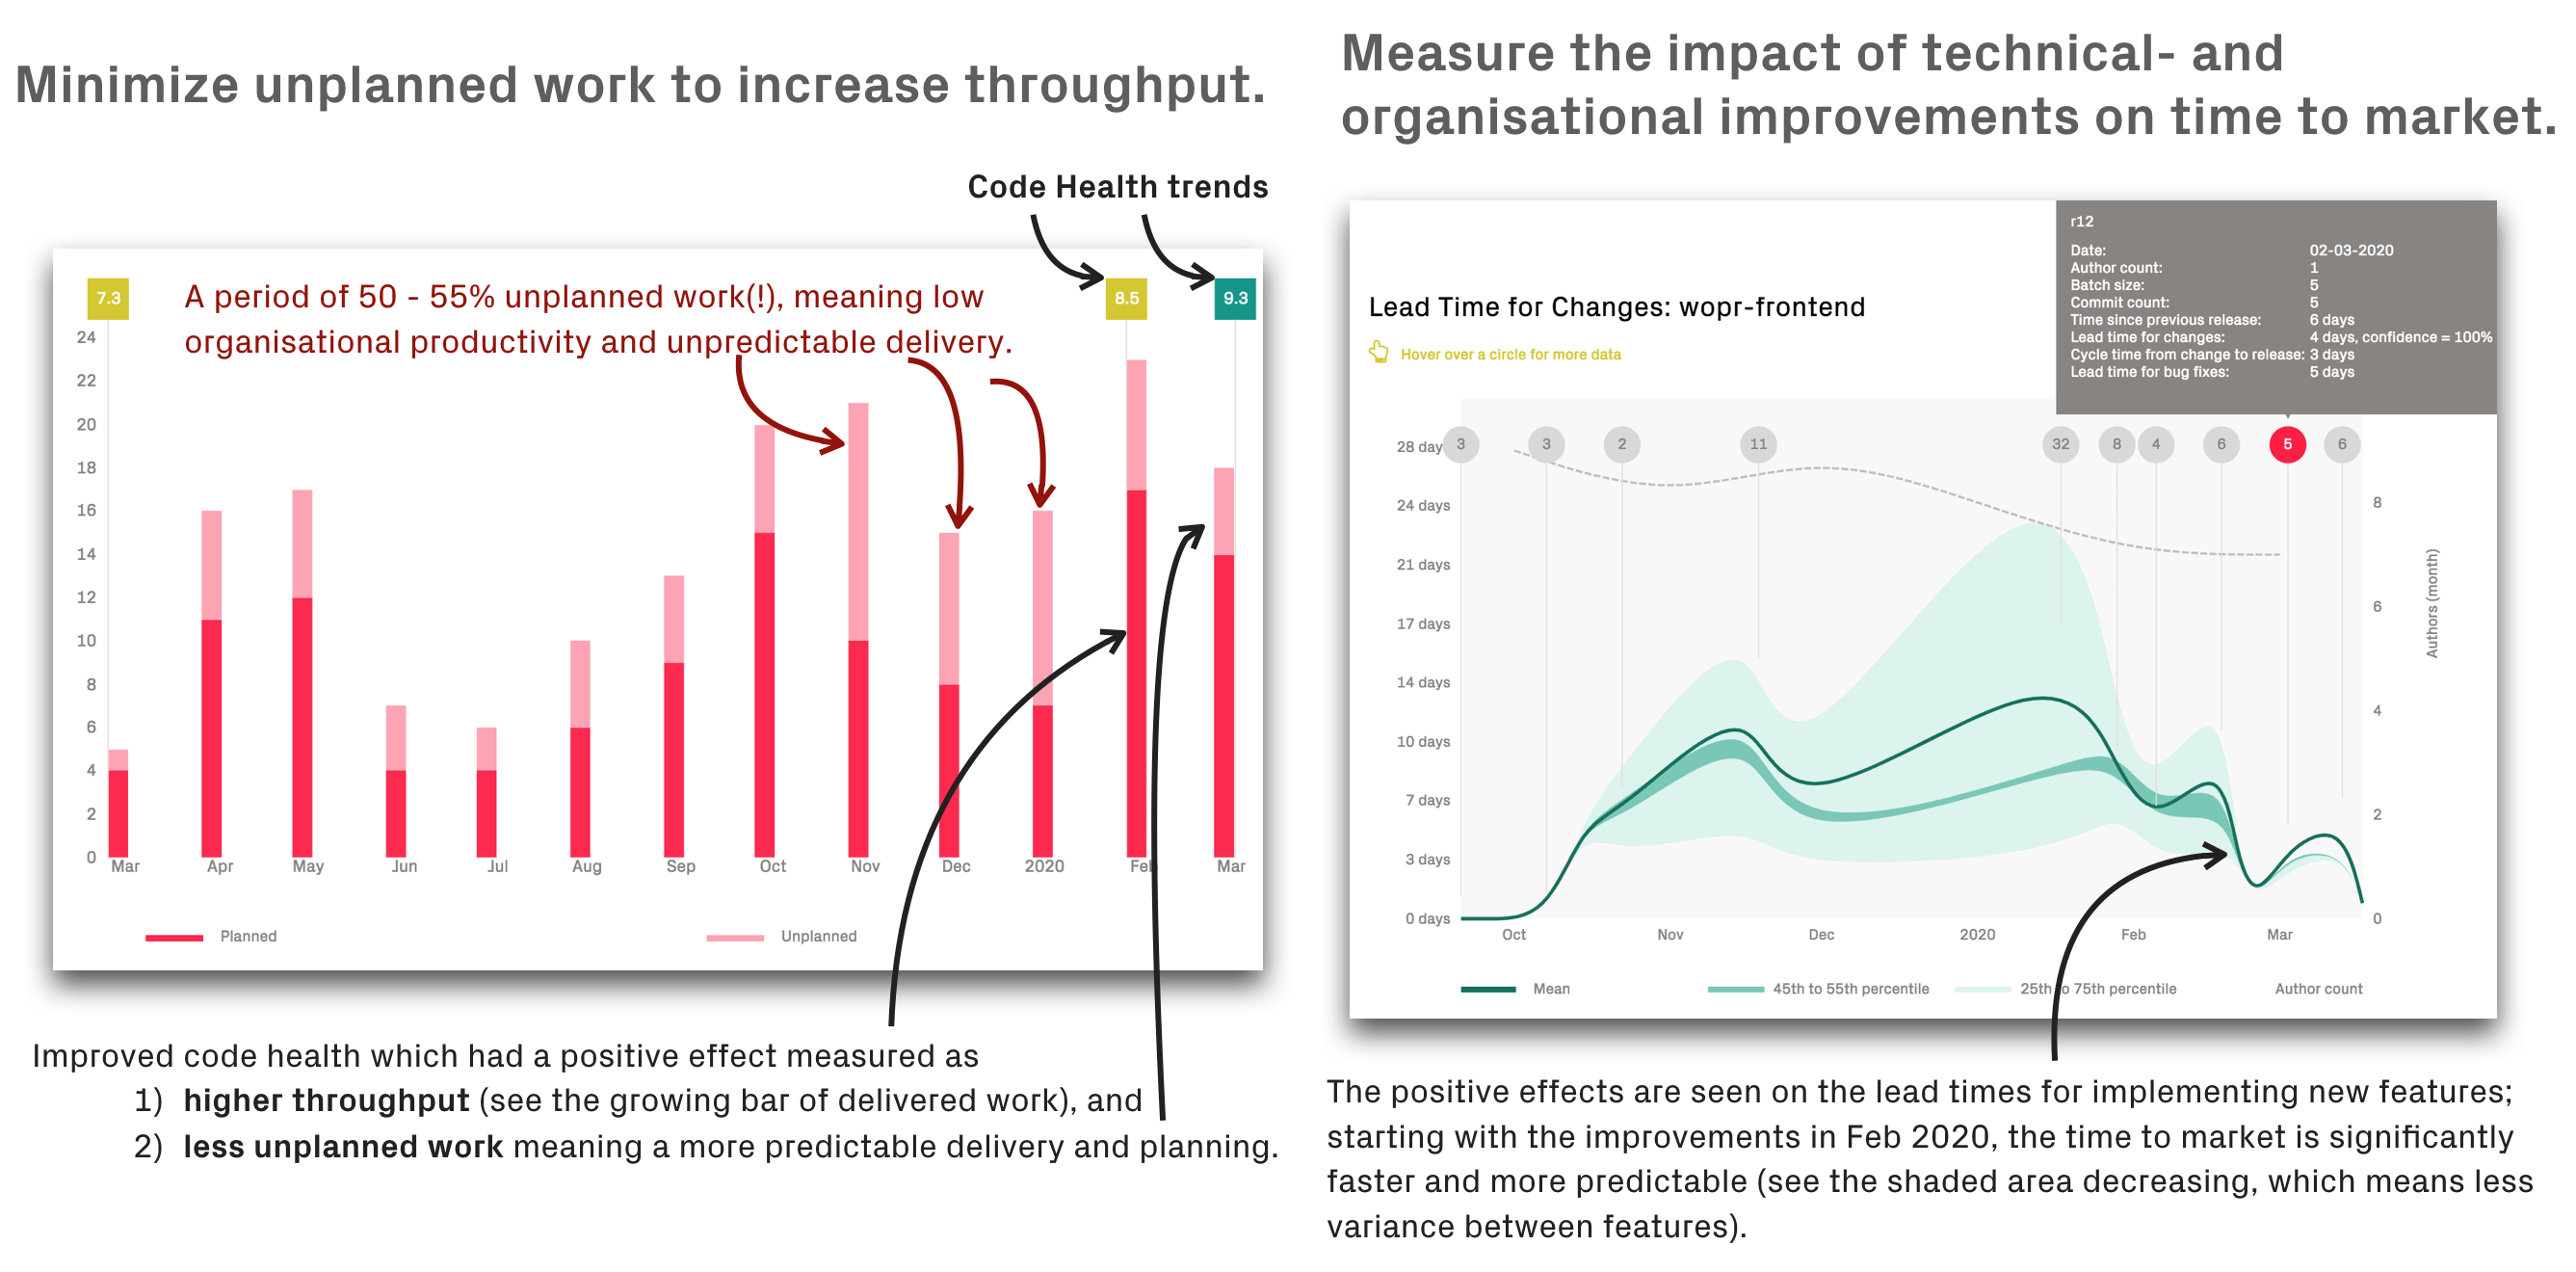
Fig. 170 CodeScene puts its technical and organizational metrics into a business context.
Putting Engineering Metrics into a Business Context
The Delivery Performance module puts CodeScene’s technical and organizational metrics into a business context. This CodeScene feature addresses three important use cases:
Put code metrics into a business context: To a non-technical stakeholder, terms like code complexity and technical debt are opaque and non-tangible. By showing the business impact of a declining code health trend, the engineering organization help non-technical stakeholders balance the trade-off between long- and short-term goals.
Example: Can we continue to churn out new features, or is it time to take a step back and invest in improved code quality?
Bride the communication gap between engineering and business: Despite an increased focus on cross-functional collaboration and powerful organizational strategies like DevOps, most software projects still face a communication gap that often results in missed deadlines and low efficiency. To key to sucessful delivery is to ensure that all stakeholders – both engineering and business – have the same view of what the system looks like and how healthy it is. We need situational awareness.
Example: Developers know if we take on excess technical debt, but as a development team rarely own their time. Business do. With the Delivery Performance metrics, we can shift the discussion from the technical impact (“oh, our code has declined in health”) to discuss the business impact: “our time to market has increased with 20%, and a likely reason is the measureable decline in code health”.
Feedback on technical and organizational change: It’s valuable to illustrate the effects of larger refactorings. The engineering organization gets immediate feedback by Integrate CodeScene in your CI/CD Pipeline, and using the Delivery Performance, management can now get the same feedback from a business perspective.
Example: A critical feature is re-designed as a response to increasing maintenance costs. Use the Delivery Performance to show that this investment paid off in terms of less unplanned work (see the graphs above for a real-world example).
Increase capacity by optimizing the bottleneck: Most aspects of software development are opaque. As such, it’s way to easy to act on increasing lead times by throwing more people at the problem, taking on excess coordination costs in the process. Acting on CodeScene’s technical and organizational metrics often open a different set of possibilities; what if we paid down the technical debt in the prioritized hotspots? What if we re-aligned our development teams with the way the system evolves? What if we automate the integration tests for our sub-system hotspots? Using the Delivery Performance metrics, you can measure the impact on throughput and cycle times in real time.
Example: Instead of hiring more consultants to staff the development teams, look to reduce the amount of unplanned work to gain free – and existing – capacity to work on new features.
Defining the Metrics: Delivery Performance Measures Lead Times and Cost Trends
CodeScene’s Delivery Performance module focuses on throughput and lead time metrics that are known to correlate with business values like time to market, customer satisfaction, and profitability (see Accelerate: The Science of Lean Software and DevOps by Forsgren, Humble, and Kim for a deeper read on this topic). We also focus on highlighting the costs and trends in unplanned work such as bug fixes and re-work.
Like most CodeScene metrics, the emphasize is on trends over absolute values. That is, it’s more important that you – as an organization – move in the desired direction than to compare your performance against any other entity in a different context. Let’s look at an example in Fig. 171.
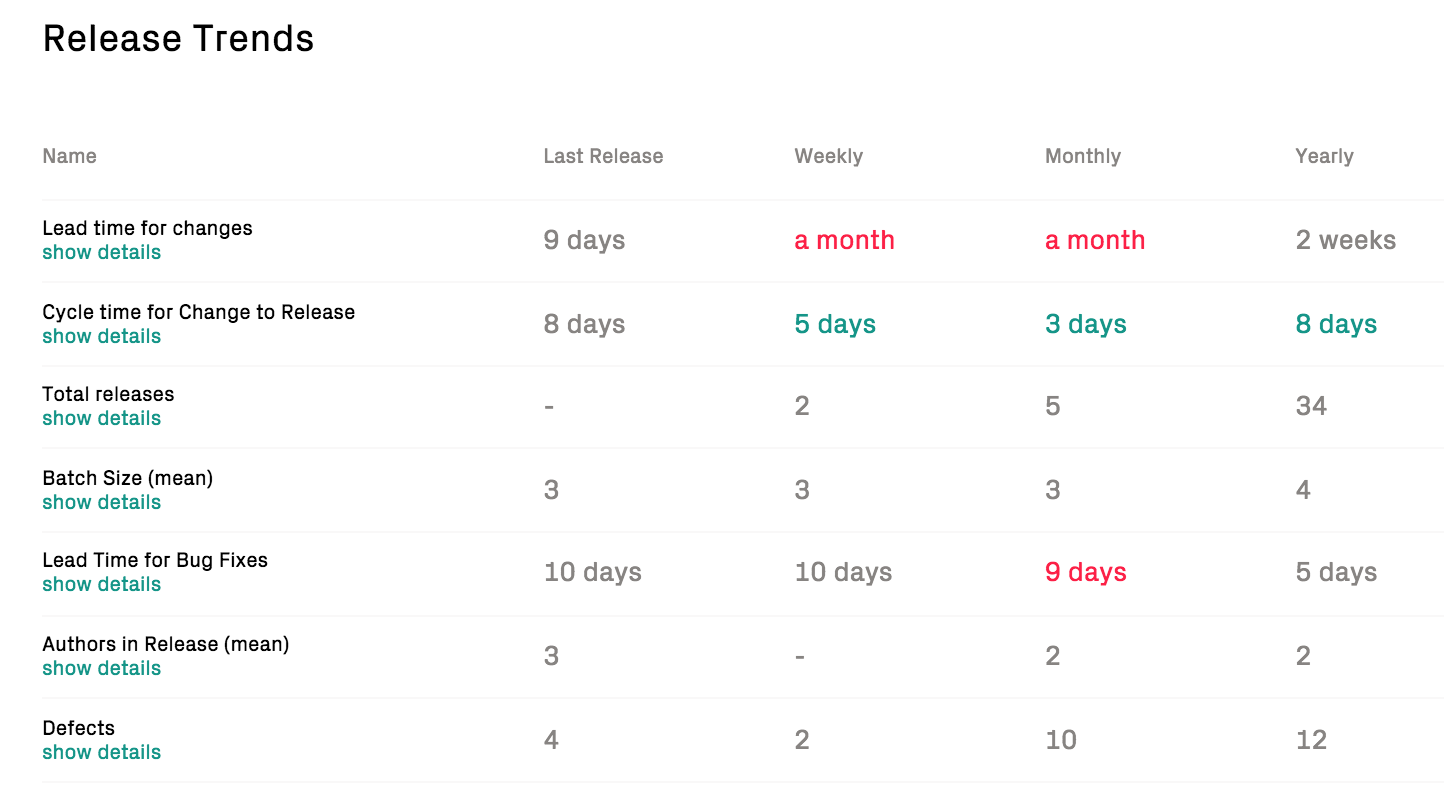
Fig. 171 CodeScene calculates trends based on the periodic releases.
The metrics are measured as follows:
- Lead Time for Changes: The lead time starts when a Jira issue enters an in progress/development state, and ends when the feature is included in a release. This is typically the most important metrics since lead times correlate with time to market.
- Defects: It would be trivial to shorten lead times if we compromised quality. Hence, we measure the number of defects fixed in each release. An increase might signal positive aspects like improved testing, or – more frequently – a degradation in external quality.
- Cycle Time from Change to Release: This cycle time starts when a commit is made until the commit is included in a release. A long cycle time from change to release indicates a bottleneck in the delivery process such as in-efficent code reviews, over-reliance on manual verification, or simply to in-frequent releases.
- Lead Time for Bug fixes: Measures the time from opening a bug/defect in Jira until the bug fix is included in a release. A long lead-time for bug fixes might mean that users have to wait for a response to issues, which might lead to less customer satisfaction.
- Batch Size: Measures the number of Jira issues included in a release. Efficient delivery is much about minimizing the amount of parallel work and releasing new features in small batches; the larger our releases, the more expensive it is to debug and isolate potential failures.
Throughput: Measure the Costs of Planned vs Unplanned Work
In “The Phoenix Project” – a wonderful book and favourite of the CodeScene team – Gene Kim describes unplanned work as “the silent killer of IT organizations”. Unplanned work steals capacity and leads to inherently unpredictable delivery that turns an organization into a reactive rather than pro-active entity. Minimizing unplanned work is paramount to any IT organization.
For that purpose, CodeScene’s Delivery Performance module provides a categorization of those development costs into Planned and Unplanned work:
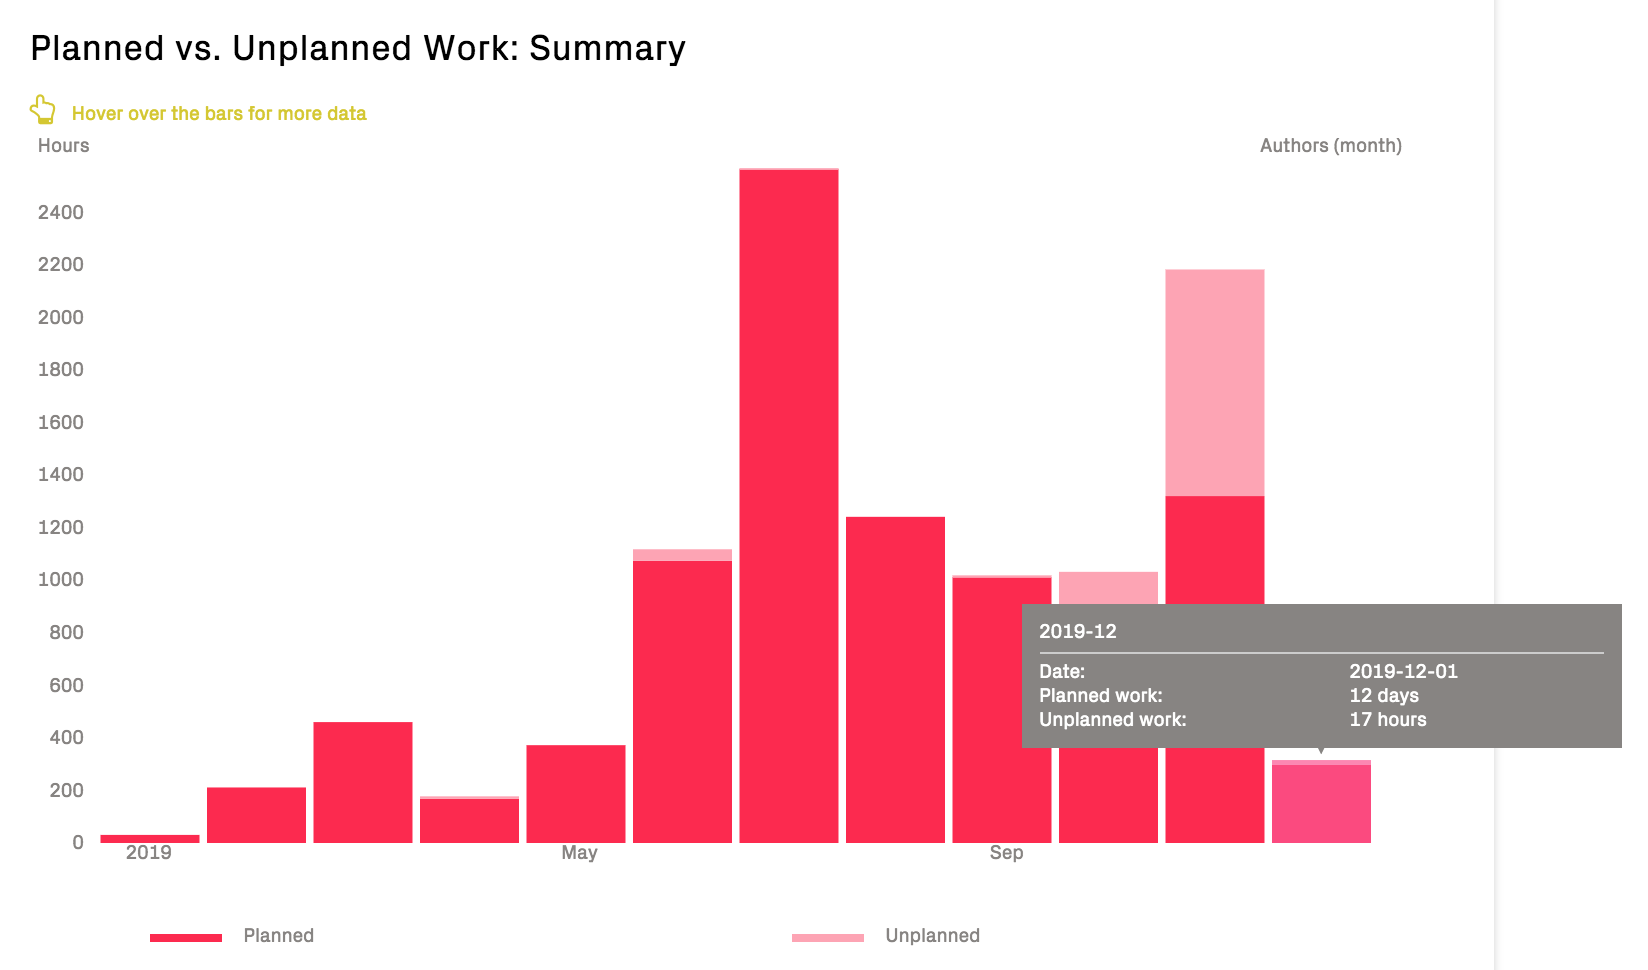
Fig. 172 Inspect how the development capacity is spent; do we spend our time mainly on Planned or Unplanned work?
The categorization is performed based on your configuration of the project managegement integration. Typically, everything related to features or planned re-work is categorized as Planned, whereas bugs, re-work, and service interruptions are Unplanned.
The amount of Unplanned work indicates the unrealized potential that can be optimized in an organization’s delivery efficiency; minimizing the amount of Unplanned work leads to more predictable progress and delivery pace.
The costs for Planned vs Unplanned work are measured using the configured cost model and unit, e.g. hours, issues, points, described in Integrate Costs and Issues into CodeScene (Jira, Trello, Azure DevOps and GitHub Issues).
Detailed Delivery Performance Graphs
All lead times and quality trends are complemented with interactive graphs that let you detect outliers and inspect specific releases.
The graphs are complemented with a trend showing the size of the development team over time. The rationale for including the scale of the team is that declining delivery performance trends often indicate on-boarding costs and/or increased communication and coordination needs (see Delivery Effectiveness by Organizational Trends for suggested follow-up analyses).
Interpret the Graphs
Here’s an example on a dramatic increase in lead times that indicate a delivery issue:
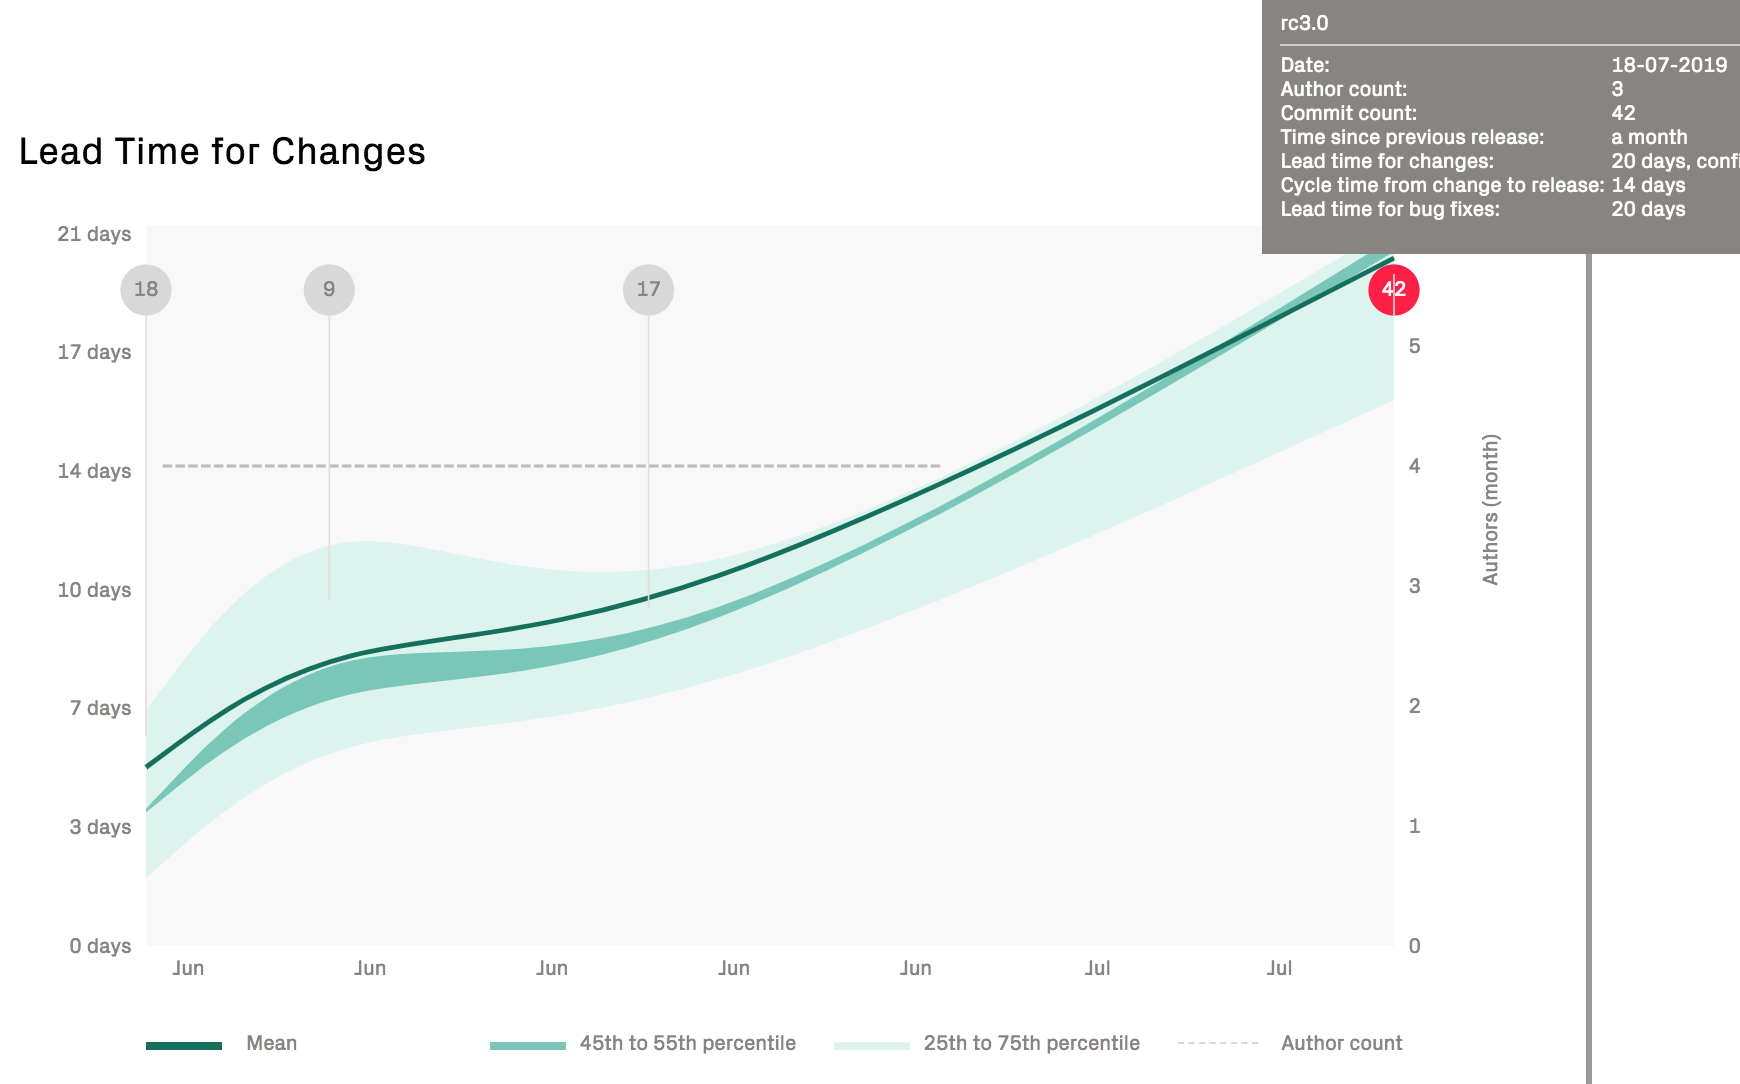
Fig. 173 Increasing lead times might indicate either organizational issues, planning problems, or growing technical debt.
The previous graph should be an immediate call to arms to uncover the potential bottlenecks in the product development. For that purpose, turn to CodeScene’s other metrics for organizations and technical debt. It’s also worth pointing out that the batch size has been increasing significantly in the preceding graph; the popups show that the last release is almost 3 times as large as the previous release.
We can get more information on the batch size trends in the next graph:
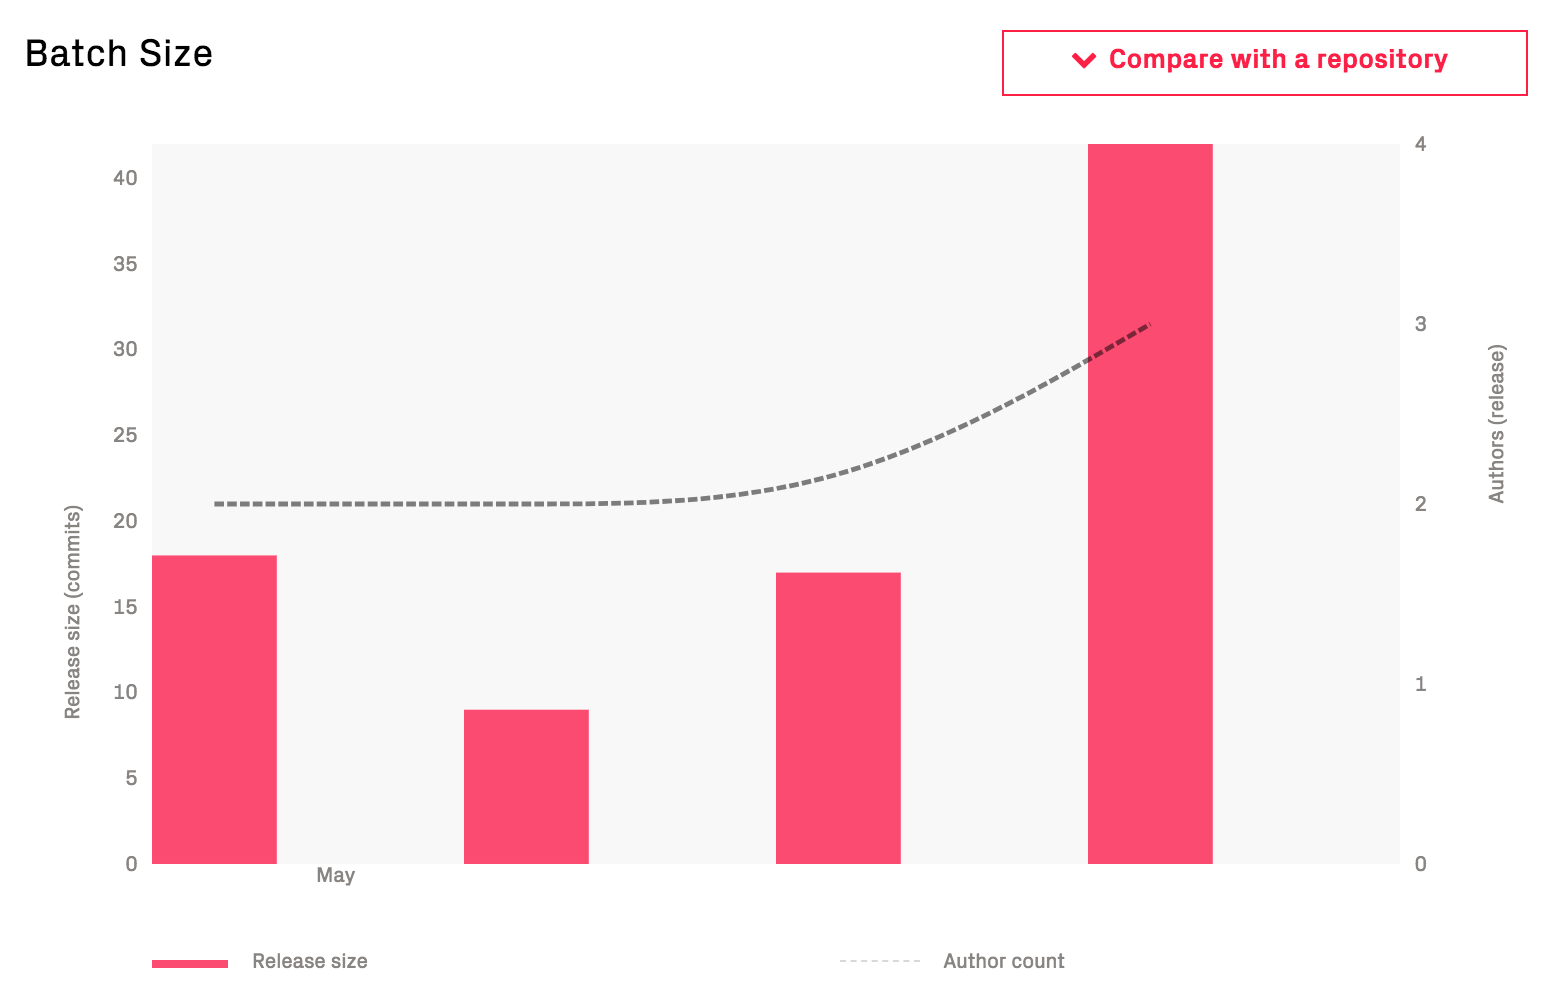
Fig. 174 Increasing batch sizes are an indication that too much work is included in each release.
Contrast the preceding trend with how the batch size looks in an organization that practices continuous delivery:
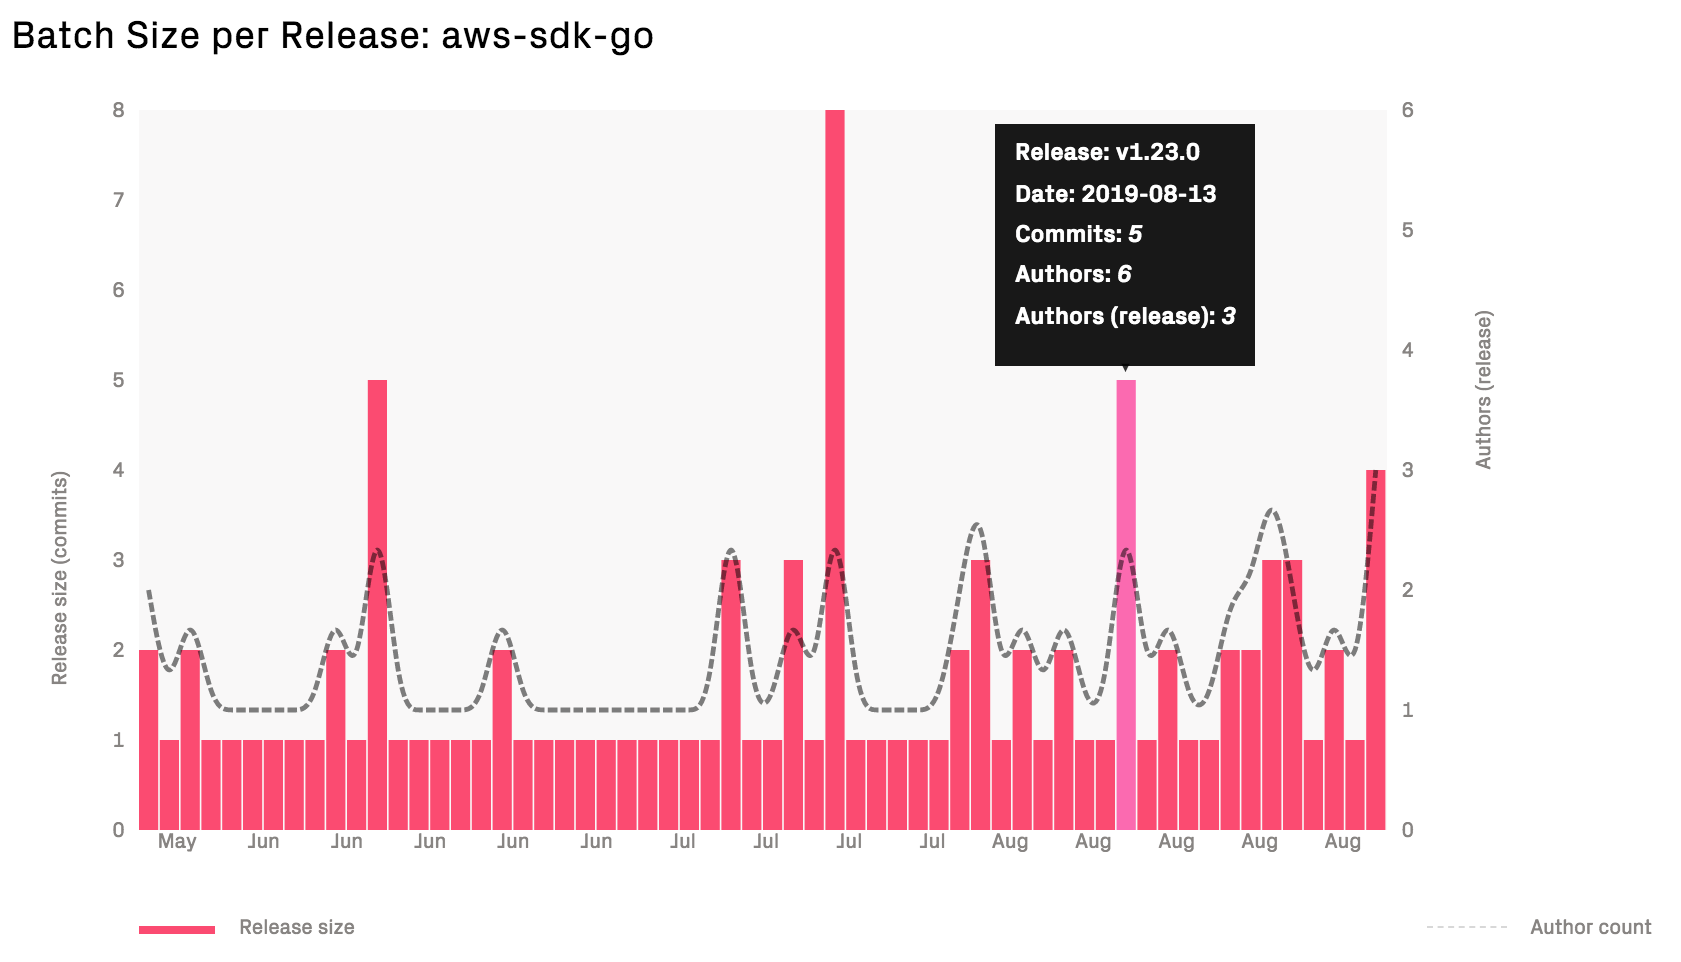
Fig. 175 In Continuous Delivery, each feature is released when it’s done.
Small batch sizes has a large impact on delivery performance; the smaller releases we do, the easier it is to track down and isolate any errors or failures.
Use Predictive Analytics as Early Warnings
CodeScene’s delivery performance module also includes a set of predictive analytics that provide feedback on the work in progress. That is, CodeScene calculates metrics on the yet to be released commits and issues as shown in Fig. 176.
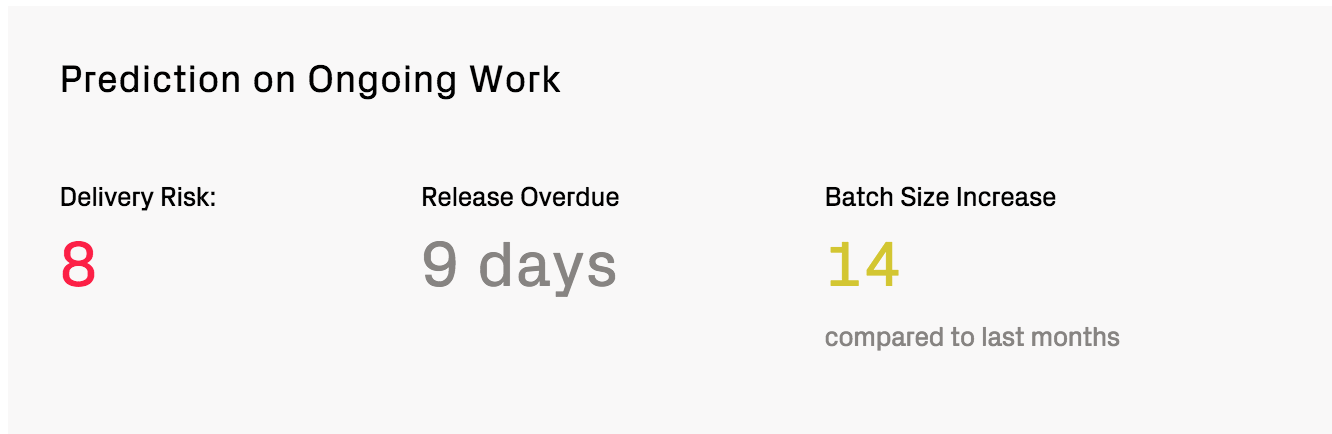
Fig. 176 Use the predictions on the upcoming release as early warnings.
These predictions are based on patterns in how you – as an organization – has worked so far; that’s how CodeScene knows that according to your typical ways of working, you should have released 9 days ago. Use such feedback as an indication that it might be time to cut the scope and wrap up the ongoing release.
The predictions on ongoing work serve as visual reminders on the importance of maintaining short lead times and to limit work in progress.
Delivery Performance Summary and Repository Specific Drill-Down
CodeScene generates a Summary view of the delivery performance for projects that include multiple Git repositories. The purpose of the summary is to identify the bottleneck repository in the delivery chain.
From the Summary view, you can then drill into a specific repository to view its metrics:
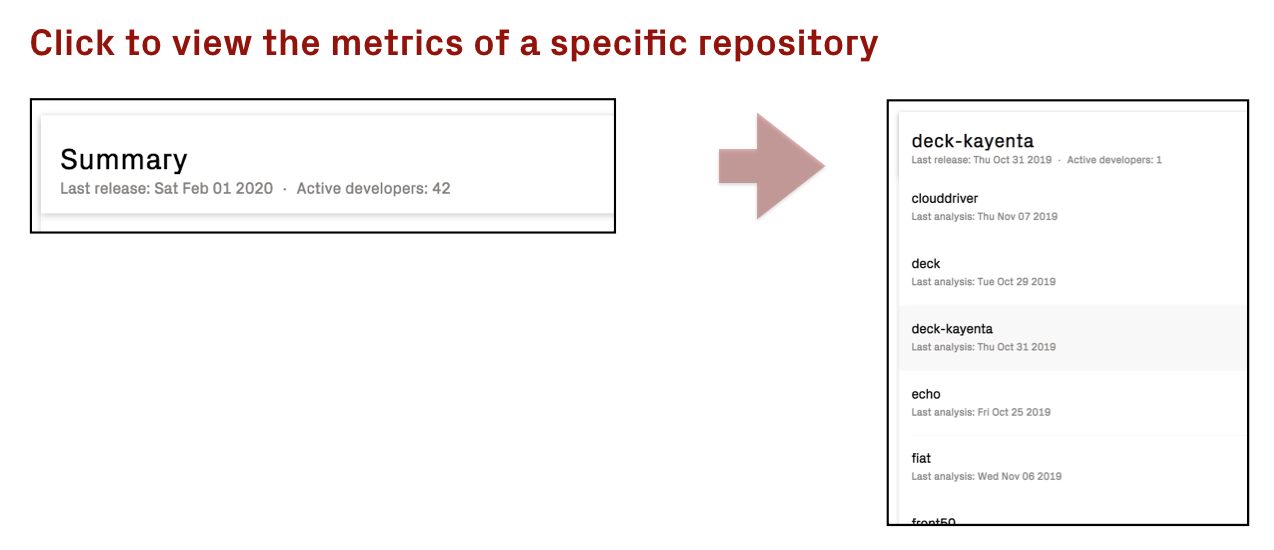
Fig. 177 Drill down into a specific repository to view its delivery performance metrics.
Pre-Requisites for the Delivery Performance Metrics
The delivery performance metrics require the following data:
- CodeScene integration with project management tools, see Integrate Costs and Issues into CodeScene (Jira, Trello, Azure DevOps and GitHub Issues).
- Commit metadata data is used to calculate the scope, batch sizes, and cycle times. As such, each commit has to be tagged with its coresponding issue.
CodeScene supports two different strategies for calculating delivery performance, based on how your release flow works:
- Calculate trends based on state transitions captured in a project management tool (e.g. Jira, Trello). This is the default option since it works with most organization’s existing workflows. Using this option, the delivery performance data is shown as periodic weekly trends.
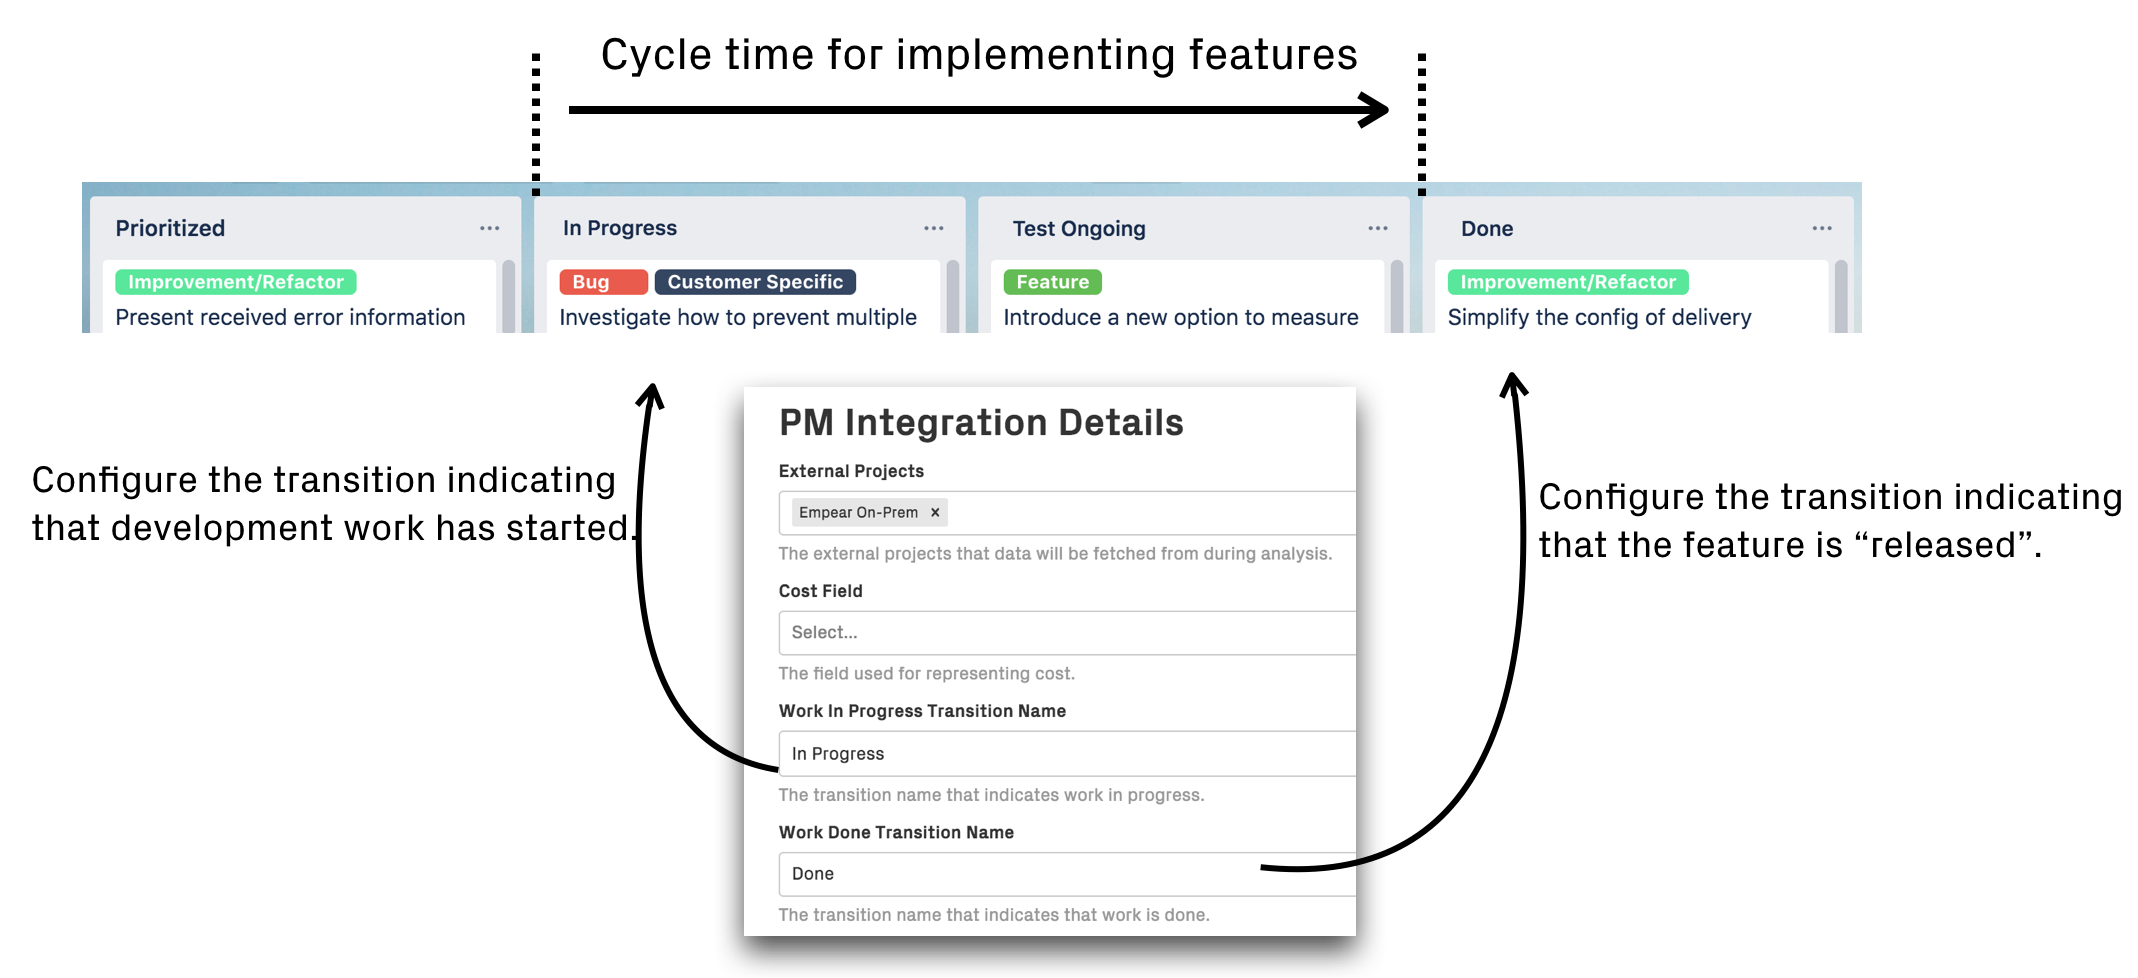
Fig. 178 The default strategy considers an issue “released” when it transitions to a specific state in a project management tool.
- Identify releases via Git tags. The second option requires that you tag all releases in Git. The advantage of this approach is that CodeScene can now uniquely identify each release and present the delivery performance data on a per release basis.
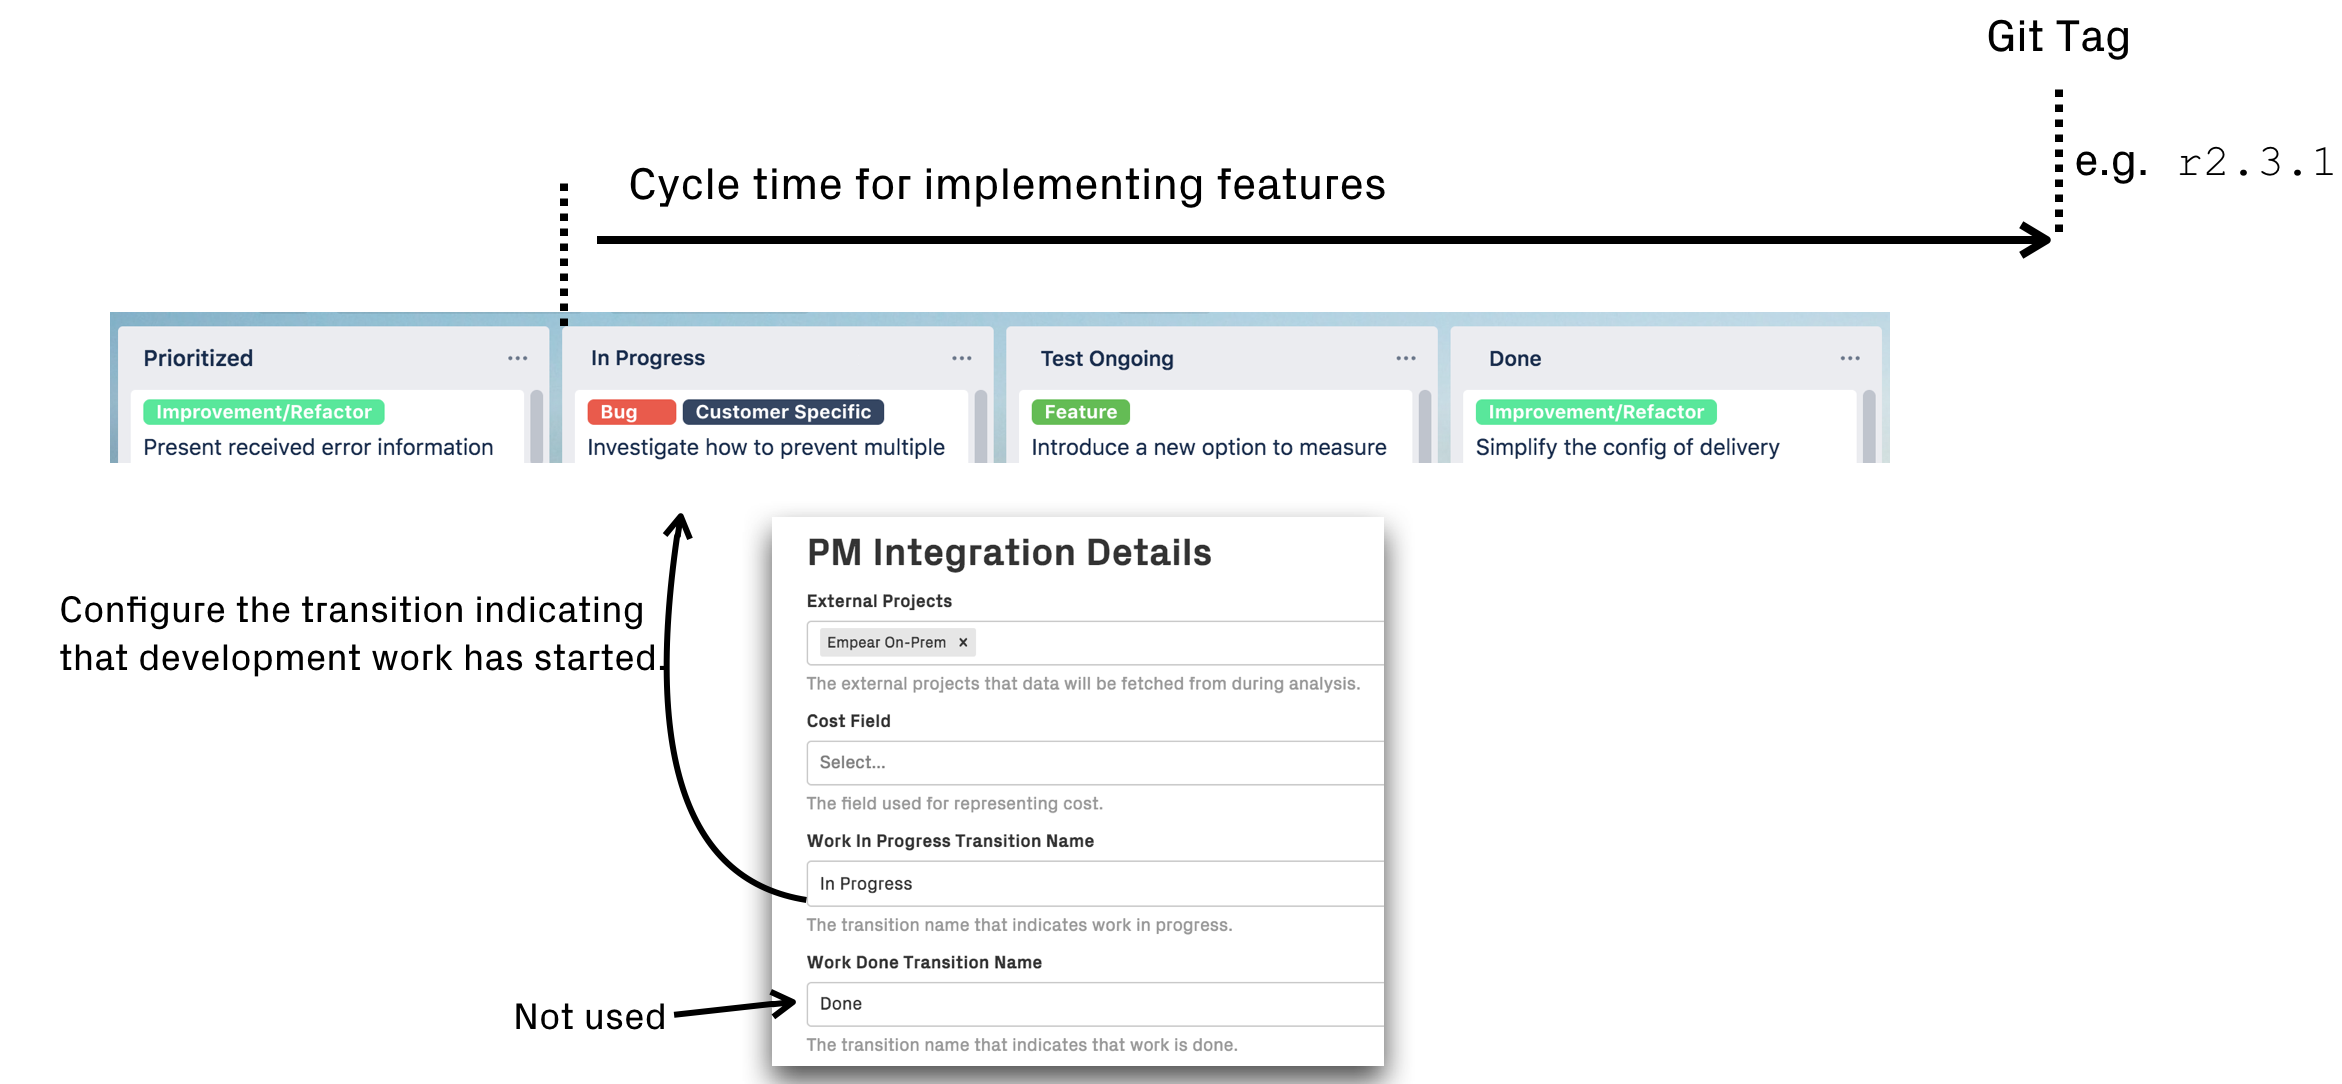
Fig. 179 A more advanced and precise alternative is to use Git tags to identify releases.
The Delivery Performance module is currently in beta status, which means it has to be enabled by a CodeScene administrator as shown in
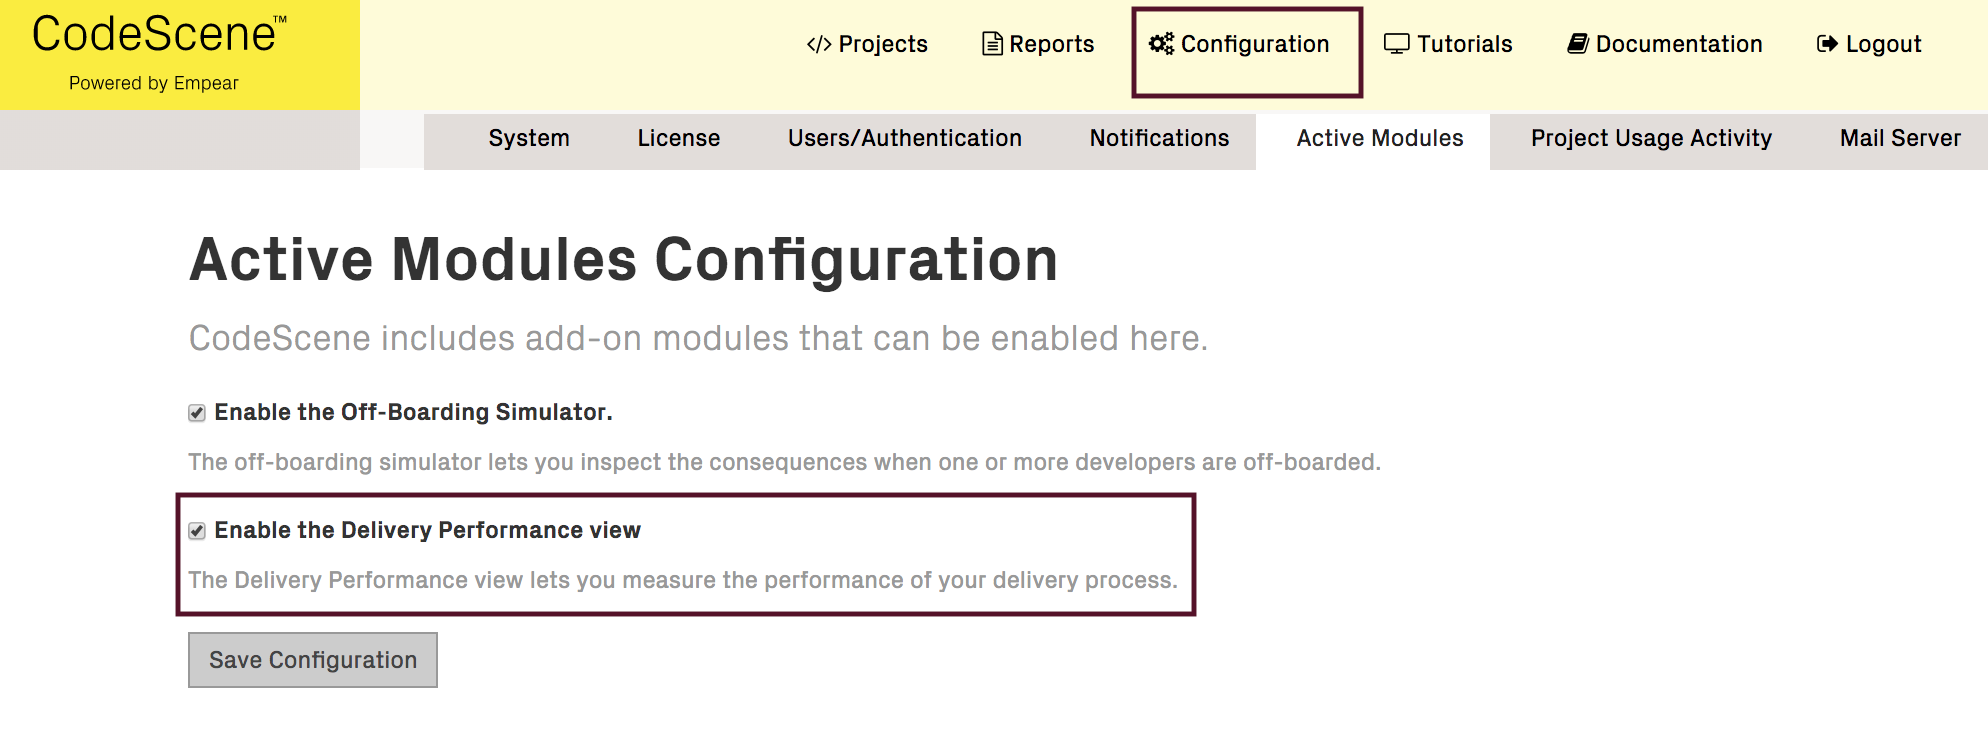
Fig. 180 Enable the Delivery Performance module in the global CodeScene configuration.
Motivation: Turning a Crisis into Success
CodeScene’s delivery performance module was built to close the gap between the engineering organization and the business side of IT. We consider that crucial; developers are the ones that act on technical debt and quality issues, but the business decides what to focus on and how the organization looks. Making sure that both business and engineering share the same view of an evolving system and have effective feedback loops is paramount to success. We capture an example in the following story.
Fig. 181 CodeScene puts its technical and organizational metrics into a business context.
The previous two graphs are from a real-world IT project. The project had gotten a good start, and now the organization decided to scale-up with more developers. However, the existing collaborative strategies were adapted for a small and tight-knit team, and didn’t scale well. As a consequence, the organization soon noticed a set of symptoms indicating deeper problems. The most visible symptom was a surge in the number of support issues. Maybe that could be resolved by hiring more testers or even expand with a first line support?
Unfortunately the problems soon went deeper. After a few fatal sprints where little progress was made, the organization decided to hire even more developers since it had to bring out long awaited features on the market. Fortunately, before making that choice, a root cause analysis was performed using an earlier version of CodeScene. The outcomes were:
- The additional engineering people they wanted to hire were already on-board. They were just busy reacting to unplanned work due to an increase in the defect rate.
- The high amount of unplanned work also meant that the most experienced people were busy doing critical ad-hoc bug fixes rather that driving the product forward or supporting the new team members. This explained why it had become so hard to plan for new features too.
- The overall throughput declined. Not only do we see a shift towards more unplanned work in the graphs above; they also show that the organization delivers less and less. Part of this efficiency loss was due to the constant context switches required to act on critical support issues. Another explanation was the increased coordination and the declining code health visible in the graph.
- Speaking of code, a likely explanation for the negative trends was found in CodeScene’s code health trends (see Code Health – How easy is your code to maintain and evolve?). There was a clear decline, starting shortly after the organization had scaled-up. The numbers were still not in the critical range, but there was a clear and problematic downwards trend, particularly in the feature areas responsible for most of the support issues.
Based on these findings, the organization acted by re-shaping their engineering and collaborative strategies. The product manager also decided to invest time into paying down the technical debt in the prioritized hotspots. Since the hotspots only made up a small part of the overall codebase, this effort gave a real effect over just two sprints. To ensure that the hotspots staid healthy, the organization also enabled CodeScene’s quality gates. By mesuring the delivery performance, management and engineering could see that their actions had a real effect.
No tool will ever save an organization, but situational awareness might.
Of course, no tool will ever save an organization, but situational awareness might. It’s key. So use the delivery performance measures to shine a light on your IT performance so that you can stay on top of the game.