Code Health – How easy is your code to maintain and evolve?
In medicine, a biomarker is a measure that might indicate a particular disease or physiological state of an organism. CodeScene’s biomarkers does the same for code. Combined with biomarker trends, this gives you a high level summary on the state of your hotspots and the direction your code is moving in.
The code biomarkers form the basis for CodeScene’s Code Health metric. The Code Health metric is a score that goes from 10 (healthy code that relatively easy to understand and evolve) down to 1, which indicates code with severe quality issues.
Code Health identifies factors known to impact Maintenance costs and Delivery Risks
The Code Health metrics is based on patterns known to correlate with increased maintenance costs. Patterns that make the code harder to understand and, hence, increase the risk of change and make the module more expensive to evolve.
The Code Health metric is calculated from a combination of both properties of the code as well as organizational factors. In total, CodeScene calculates 25-30 code biomarkers depending on programming language. Examples include – but are not limited to – the following:
- Brain Method: A single function/method that centers too much behavior and becomes a local hotspot.
- Nested Complexity: This is typically revealed as if-statements inside other if-statments and/or loops, and is a construct that significantly increases the risk for defects.
- Bumpy Road: A bumpy road is a function that fails to encapsulate its responsibilities, leading to code containing multiple logical chunks of logic. Just like a bumpy road will slow down you driving, a bumpy road in code presents an obstacle to comprehension. There’s also an increased risk for feature entanglement. The remedy is often to extract and encapsulate the chunks of logically dispersed behaviors in their own functions.
- Developer Congestion: Code becomes a coordination bottleneck when multiple developers need to work on it in parallel (see Parallel Development and Code Fragmentation).
- Knowledge Loss due to former contributors: If the developer behind a hotspot with low code healt leaves the organization, the maintenance risk increases significantly.
- DRY (Don’t Repeat Yourself) Violations: CodeScene detects duplicated logic that is actually changed together in predictable patterns.
- Primitive Obsession: Code that uses a high degree of built-in, primitives such as integers, strings, floats, often lacks a domain language that encapsulates the validation and semantics of function arguments.
In combination with the Code Health score, CodeScene’s biomarkers are like an extra, virtual team member that constantly reviews your code. Let’s look into the biomarkers.
The Ideas Behind Code Biomarkers
We at Empear make heavy use of CodeScene ourselves. We use the tool as part of our services. Over the past years we have analyzed hundreds of different codebases, and there are some patterns that we have seen repeated over and over again. Thus, we started to implement support in CodeScene to auto-detect those patterns, and we called the feature biomarkers.
The biomarkers name requires a brief explanation. In general, we wanted to avoid terms like “quality” or “maintainability” since they are easy to game and, more serious, suggest an absolute truth. Instead we find that it’s the trend that’s most important: is the code evolving in the desired direction? In addition, an algorithm, no matter how smart, can only take us so far; at some level we want a human in the loop, and the code biomarkers are there to support that human by priming them on what to look for in the specific hotspot. Let’s look at some examples.
Explore your Code’s Biomarkers
If CodeScene has biomarker support for your language (see X-Ray for a list of supported languages), you will get a high-level trend on your dashboard as shown in Fig. 59.
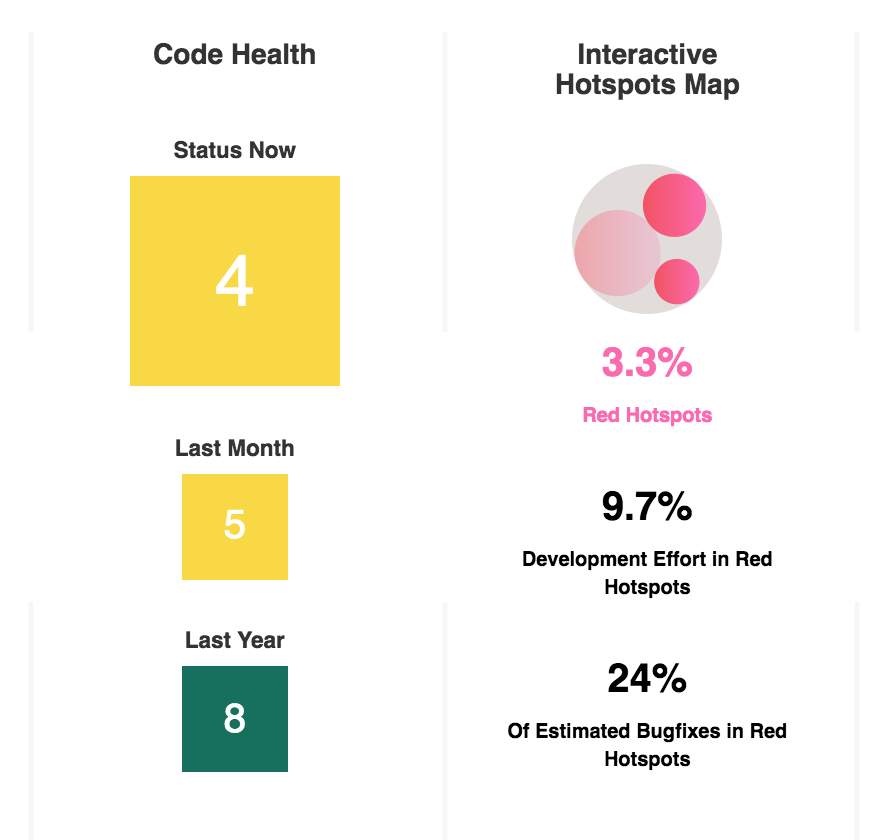
Fig. 59 Code Biomarkers summary on the analysis dashboard.
The Code Health scores on the dashboard show the (weighted) aggregation of the health of your prioritized hotspots. That is, the code that is most likely to drive the costs of new features and improvements. In this example, we see that a codebase that seems to degrade rapidly, going from a healthy score of 8 down to a low health of 4 in less than a year. That trend is a clear warning sign that the organization needs to invest more time into refactoring and code improvements.
Biomarkers Present Actionable Metrics
Before we move on, how do we know that the biomarkers and scores are relevant? Well, the biomarkers are built on top of CodeScene’s other metrics and behavioral data. That means we only score the prioritized parts of the codebase, the one’s that are most likely to impact development and maintenance costs as show in Fig. 60.
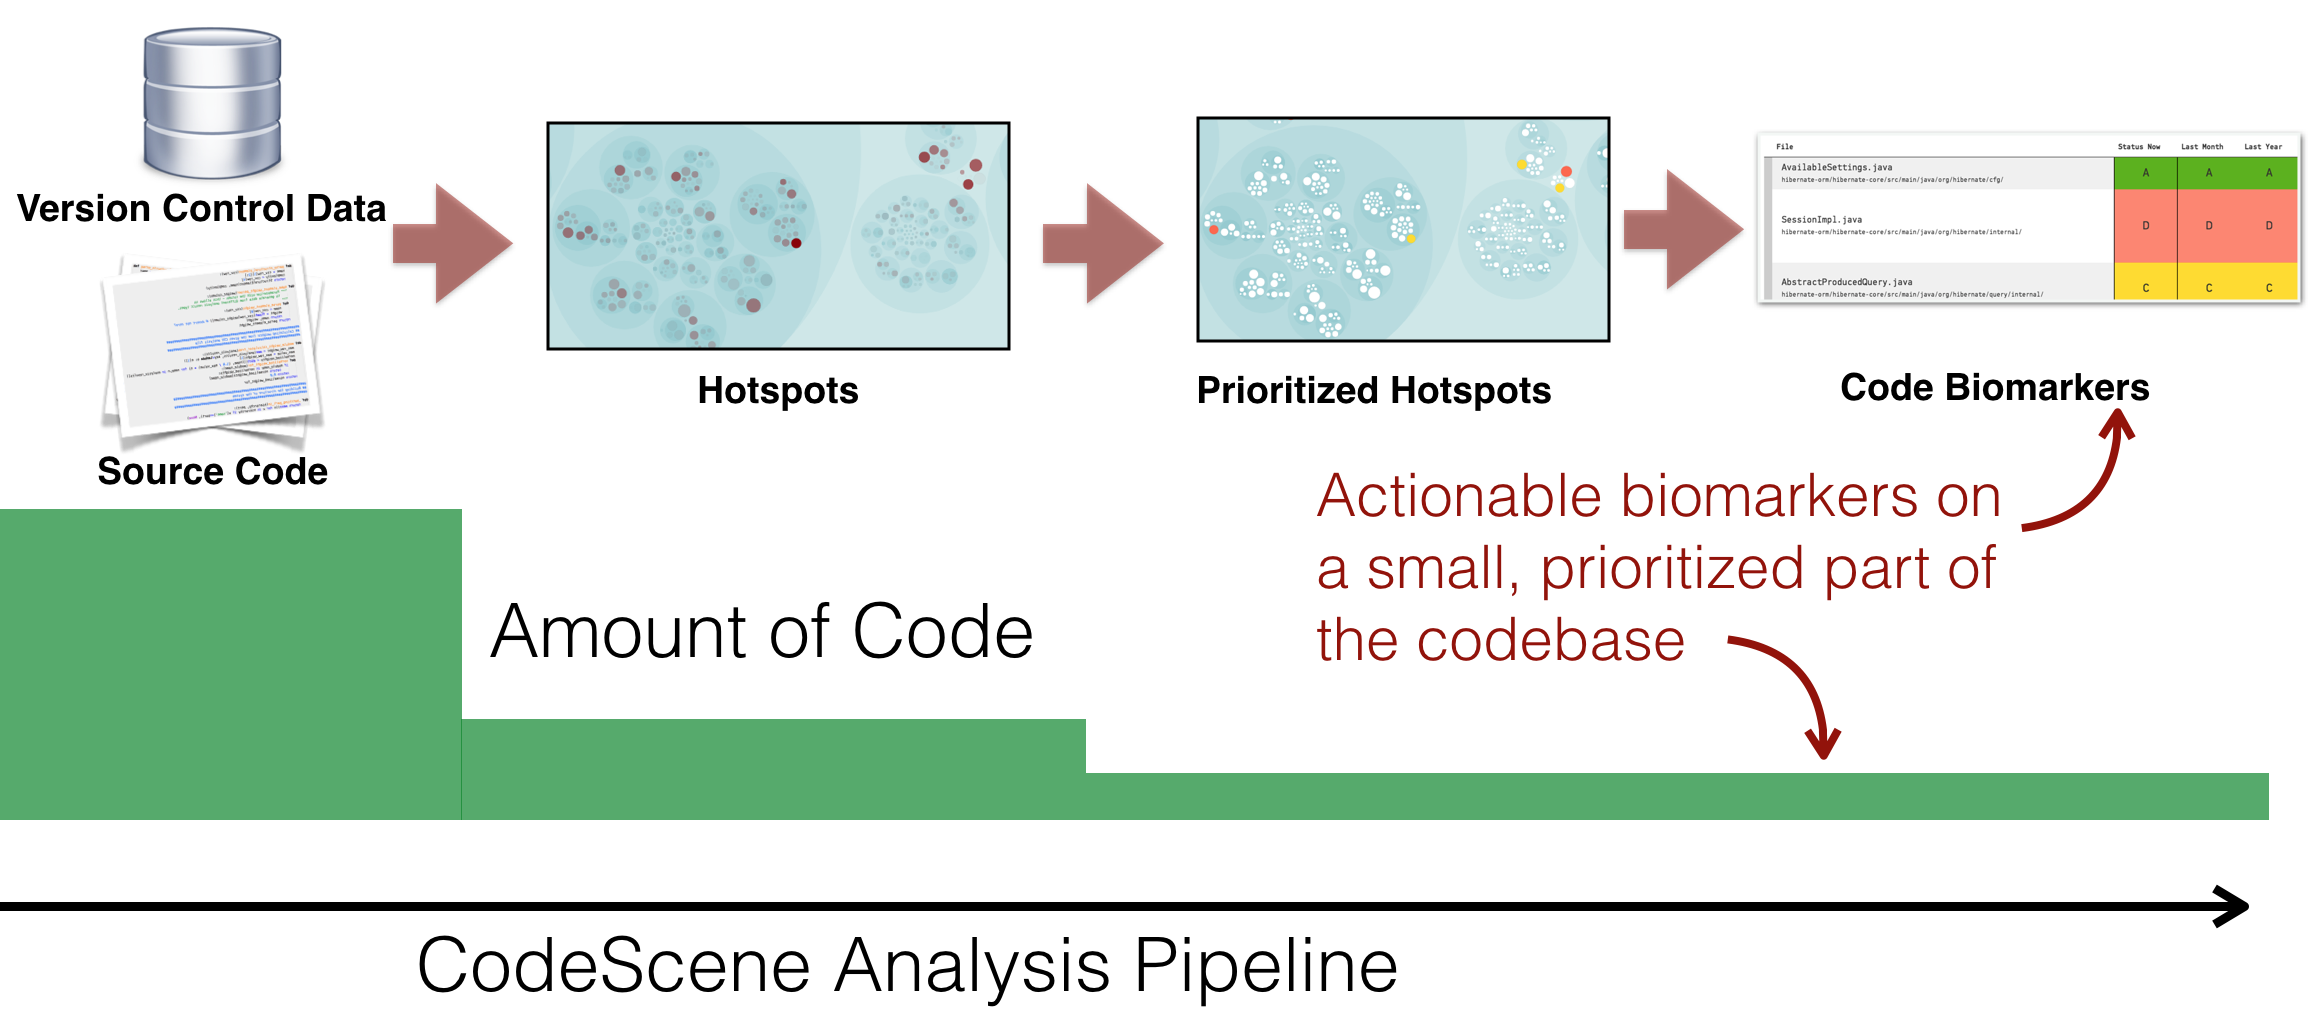
Fig. 60 Biomarkers are built on top of CodeScene’s prioritized hotspots.
Using this principle, Code Biomarkers fill a number of important gaps:
- Bridge the gap between developers and non-technical stakeholders: The biomarkers visualization provides information to managers that help decide on when to take a step back, invest in technical improvements, and measure the effects.
- Get immediate feedback on improvements: The biomarker trends gives you immediate and visual feedback on the investments you do in refactorings.
- Share an objective picture of your code quality: The biomarker scores are based on baseline data from throusands of codebases, and your code is scored against an industry average of similar codebases.
- Get suggestions on where to start refactorings: The code biomarkers hint at specific problems in each file, which also suggests which refactorings that could be used to address the findings.
Let’s demonstrate those properties by having a more detailed look at biomarkers in Fig. 61.
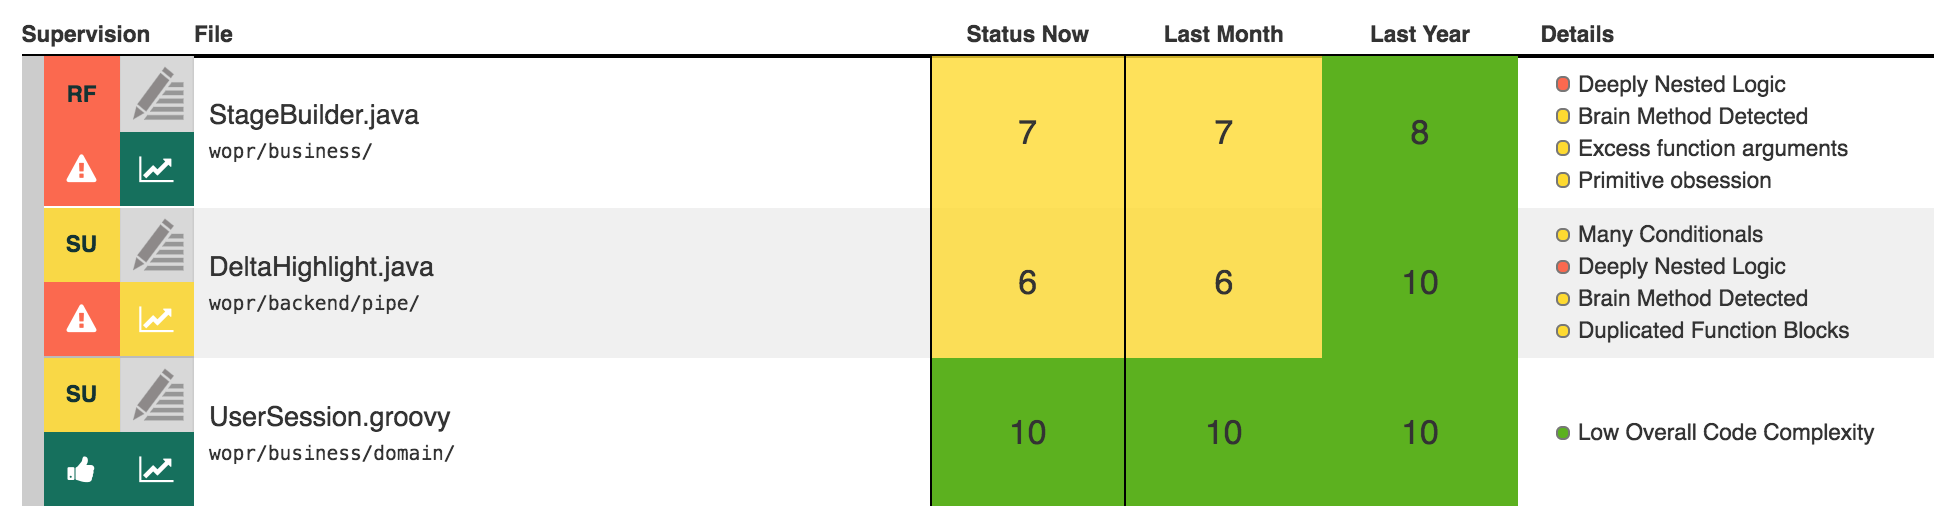
Fig. 61 Code Health Trends and Biomarkers for a specific project.
The biomarkers in biomarkers-trend-examplef provide detailed indications for each prioritized hotspot. We note that the top
hotspot, StageBuilder has declined in health over the past months. We also note the warning sign for DeltaHighlight.java, which
has degraded from a full 10 score to a medium health of 6.
Note that the organization has already planned a set of goals for the hotspots in Fig. 59 using CodeScene’s Intelligent Notes (see Manage Hotspots and Technical Debt with Goals). This is important as the goal oriented workflow that CodeScene encourages, lets you track and manage technical debt in the context of your decisions and plans. Make sure to read the tutorial in Hands On Behavioral Code Analysis: CodeScene Use Cases to ensure you get the most out of CodeScene.
Finally, we get more details when we request the virtual code review via the lab bottle next to each hotspot. Use the virtual code review as an initial step towards refactoring decaying hotspots.
Guide Refactorings via the High-Level Patterns Presented in the Virtual Code Reviewer
Often, hotspots with low code health will contain brain methods and be low on cohesion. This is an indication that the hotspot lacks modularity on both function and class level. The code biomarkers will detect this and inform you.
Follow up with an X-Ray in order to prioritize local improvements based on how likely those refactoring are to pay off.
Using X-Ray, we can also investigate the code duplication reported by a biomarker. Duplicated code usually hints at one–or more–missing abstractions that we could introduce. Hence, we recommend to run an X-Ray analysis on the file to get more insights now that we know what to look for. We show an example of a QueryTestBase.cs X-Ray in Fig. 62.
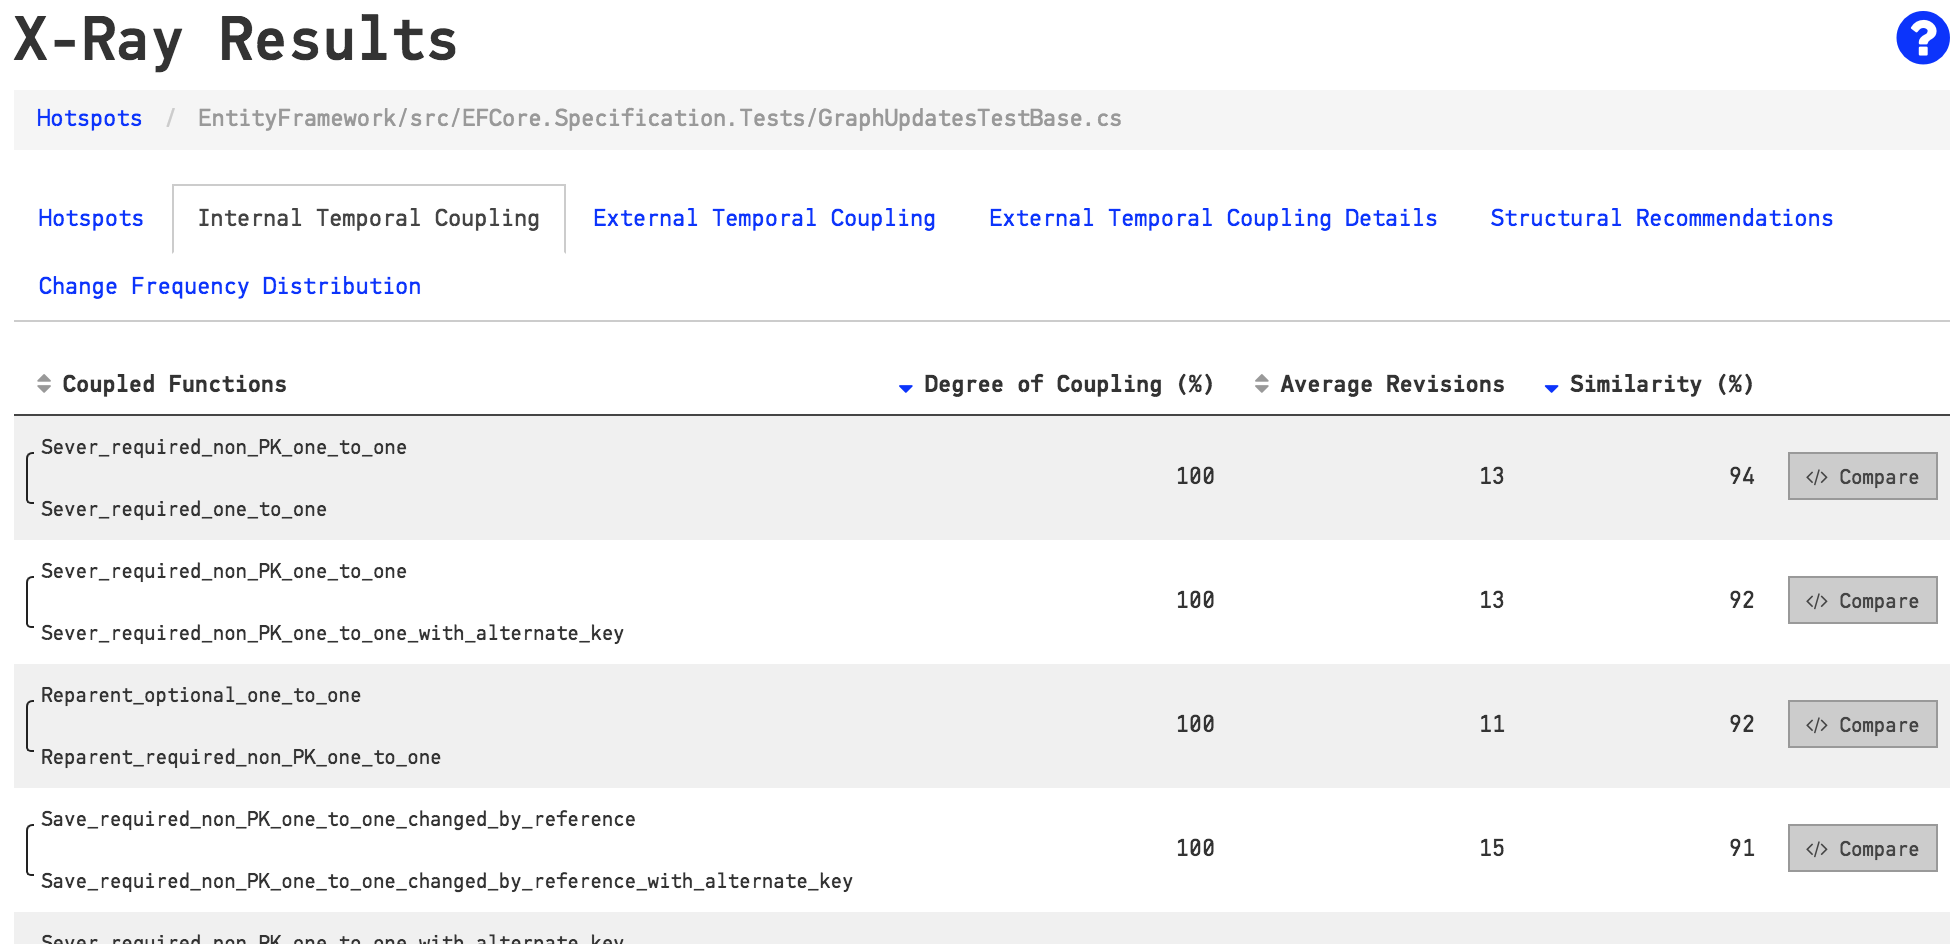
Fig. 62 Use X-Ray to follow-up on the biomarkers.
Launch the Virtual Code Reviewer to Get a Holistic View of Hotspots
You can launch a virtual code reviewer for any file. The virtual code review will aggregate the most significant metrics for your chosen file, as seen in Fig. 49.
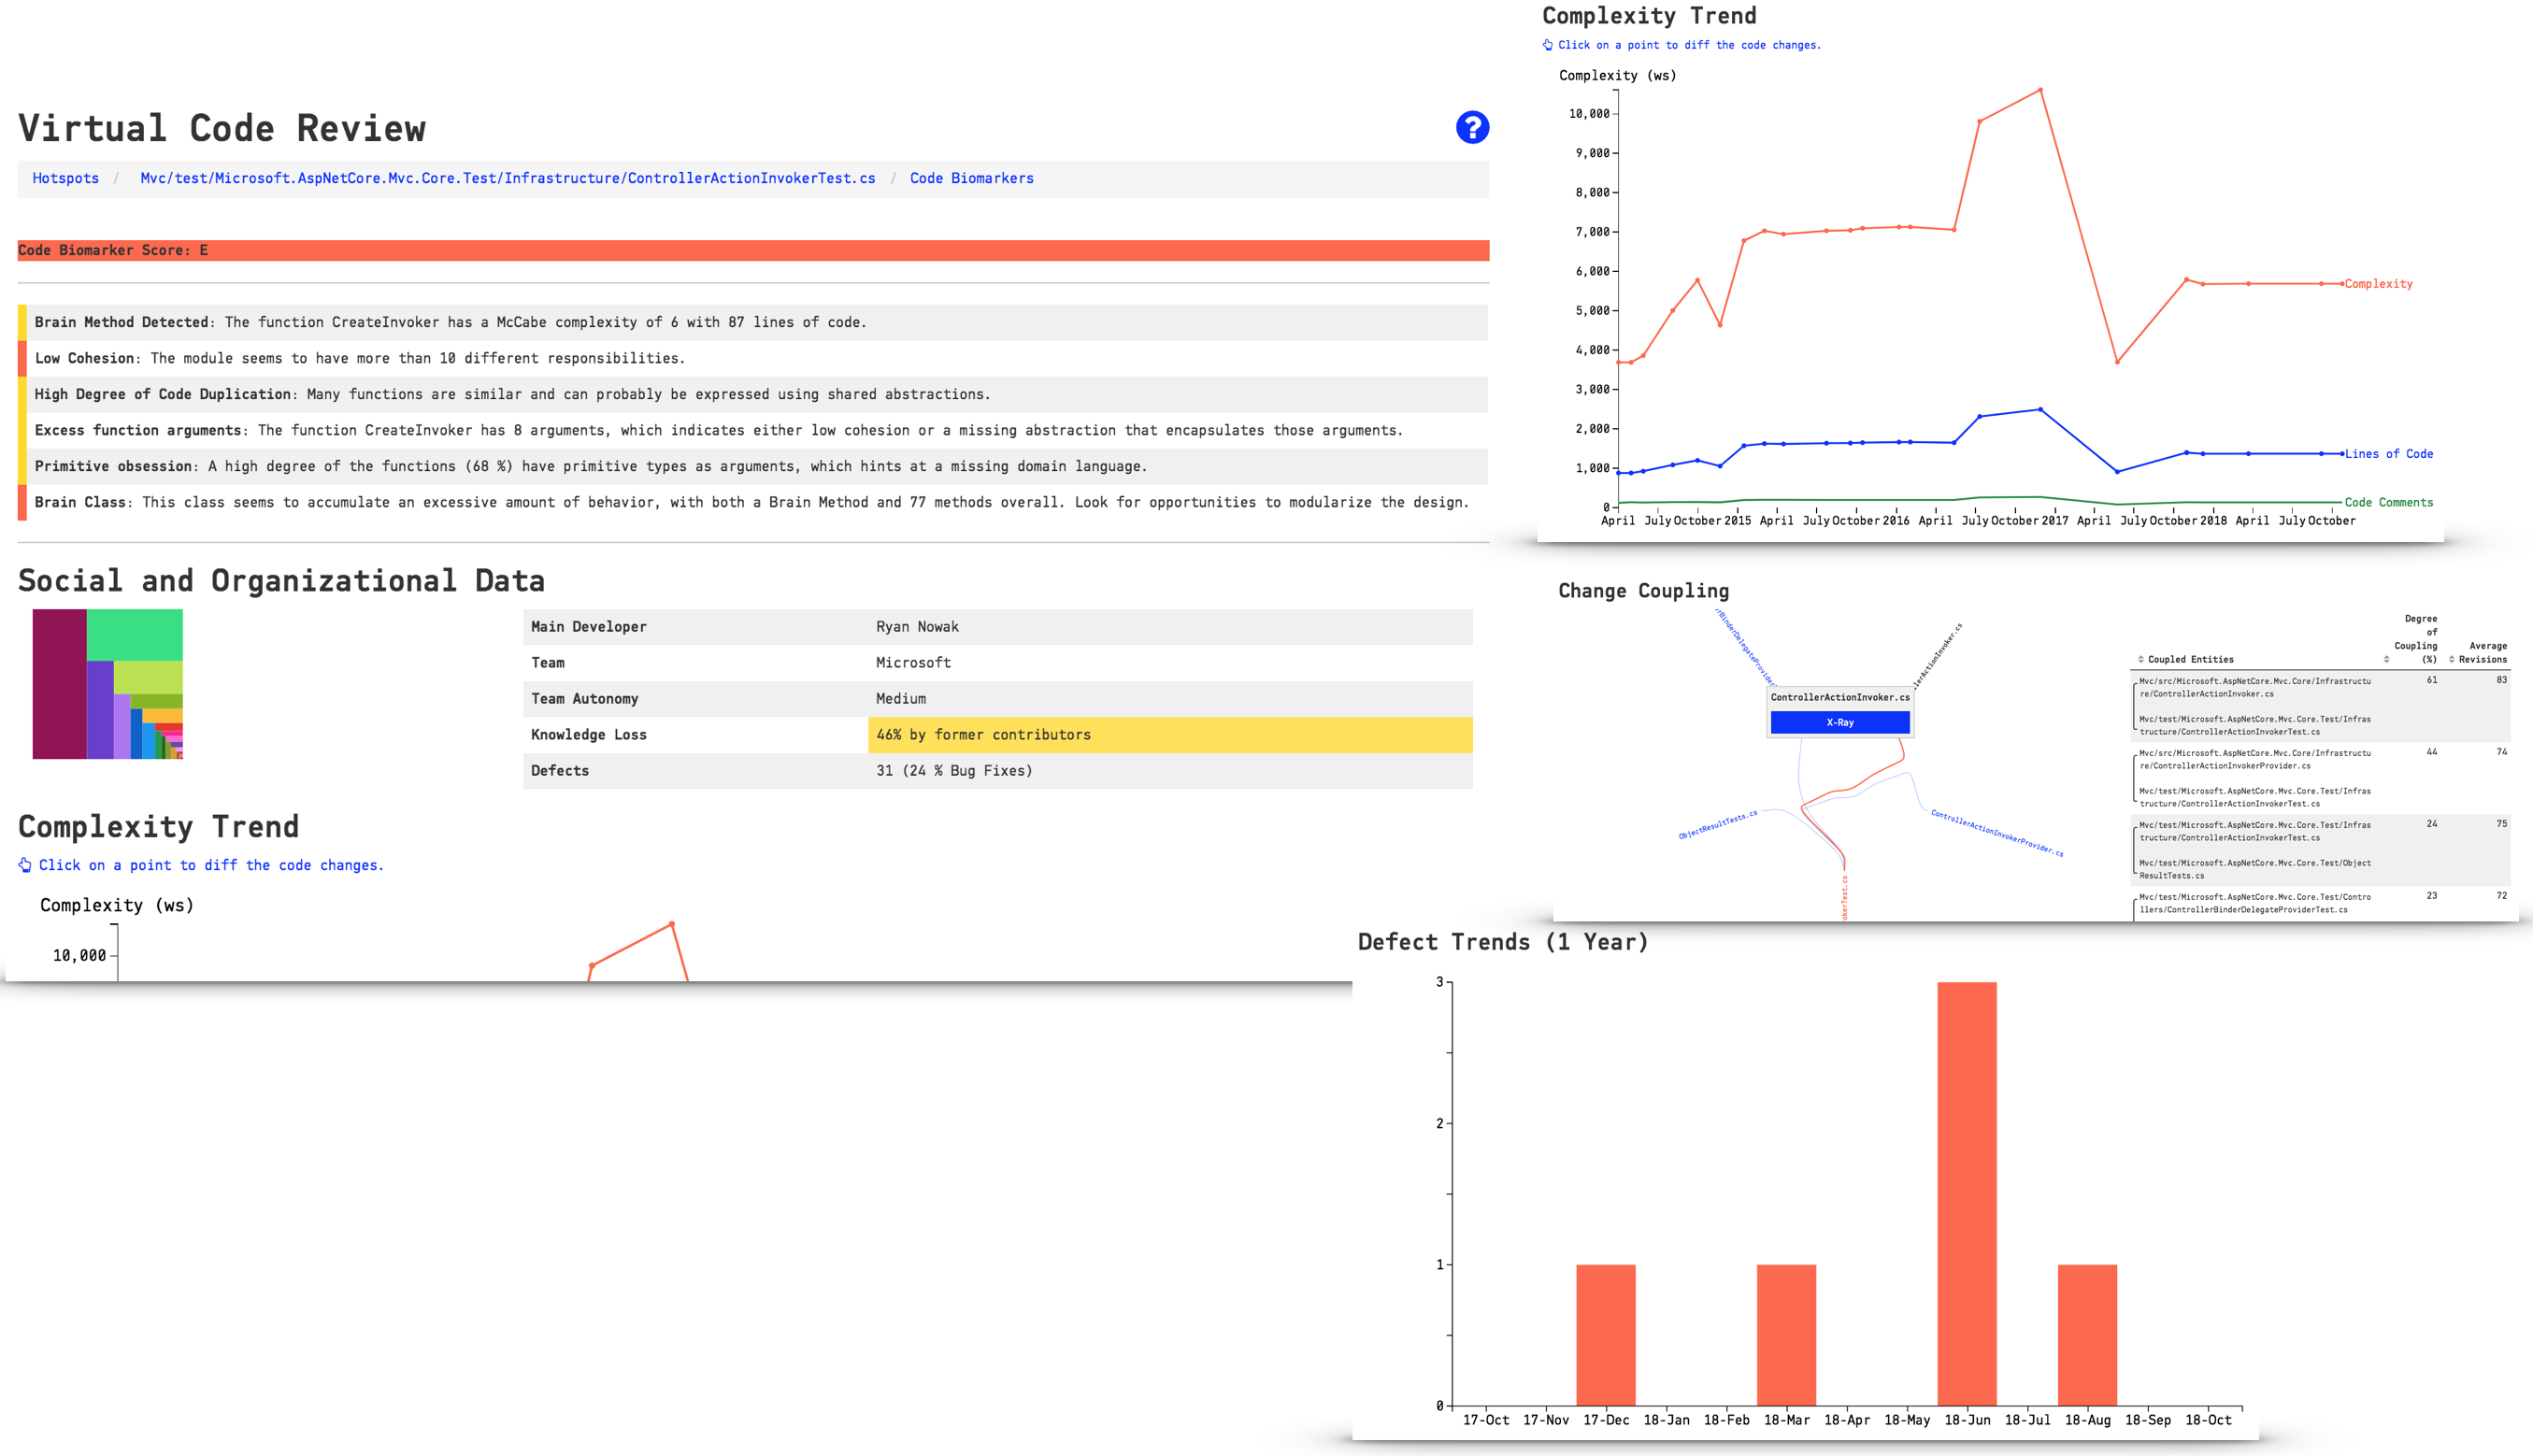
Fig. 63 Get a holistic overview of your hotspot.
The virtual code reviewer combines the social and technical analysis data you need to assess the severity of the biomarker findings:
- Review the detailed biomarker indications to spot maintenance and quality issues.
- Detect potential inter-team coordination bottlenecks that should drive refactorings through the social metrics such as the team autonomy measure.
- See if it’s a growing problem in the Complexity Trend.
- Investigate the change coupling, filtered for your selected file under review.
- Use the defect trend to estimate the cost of any technical or social debt you might find in the review.
Augment Hotspots to let CodeScene Supervise them
Once you have inspected a hotspot you can augmented the analysis with your observations. An augmented analysis lets you categorize your findings so that CodeScene can supervise and guide you based on the technical debt you identify. This augmented analysis provides a complete framework for managing technical debt and is described in detail in Manage Hotspots and Technical Debt with Goals
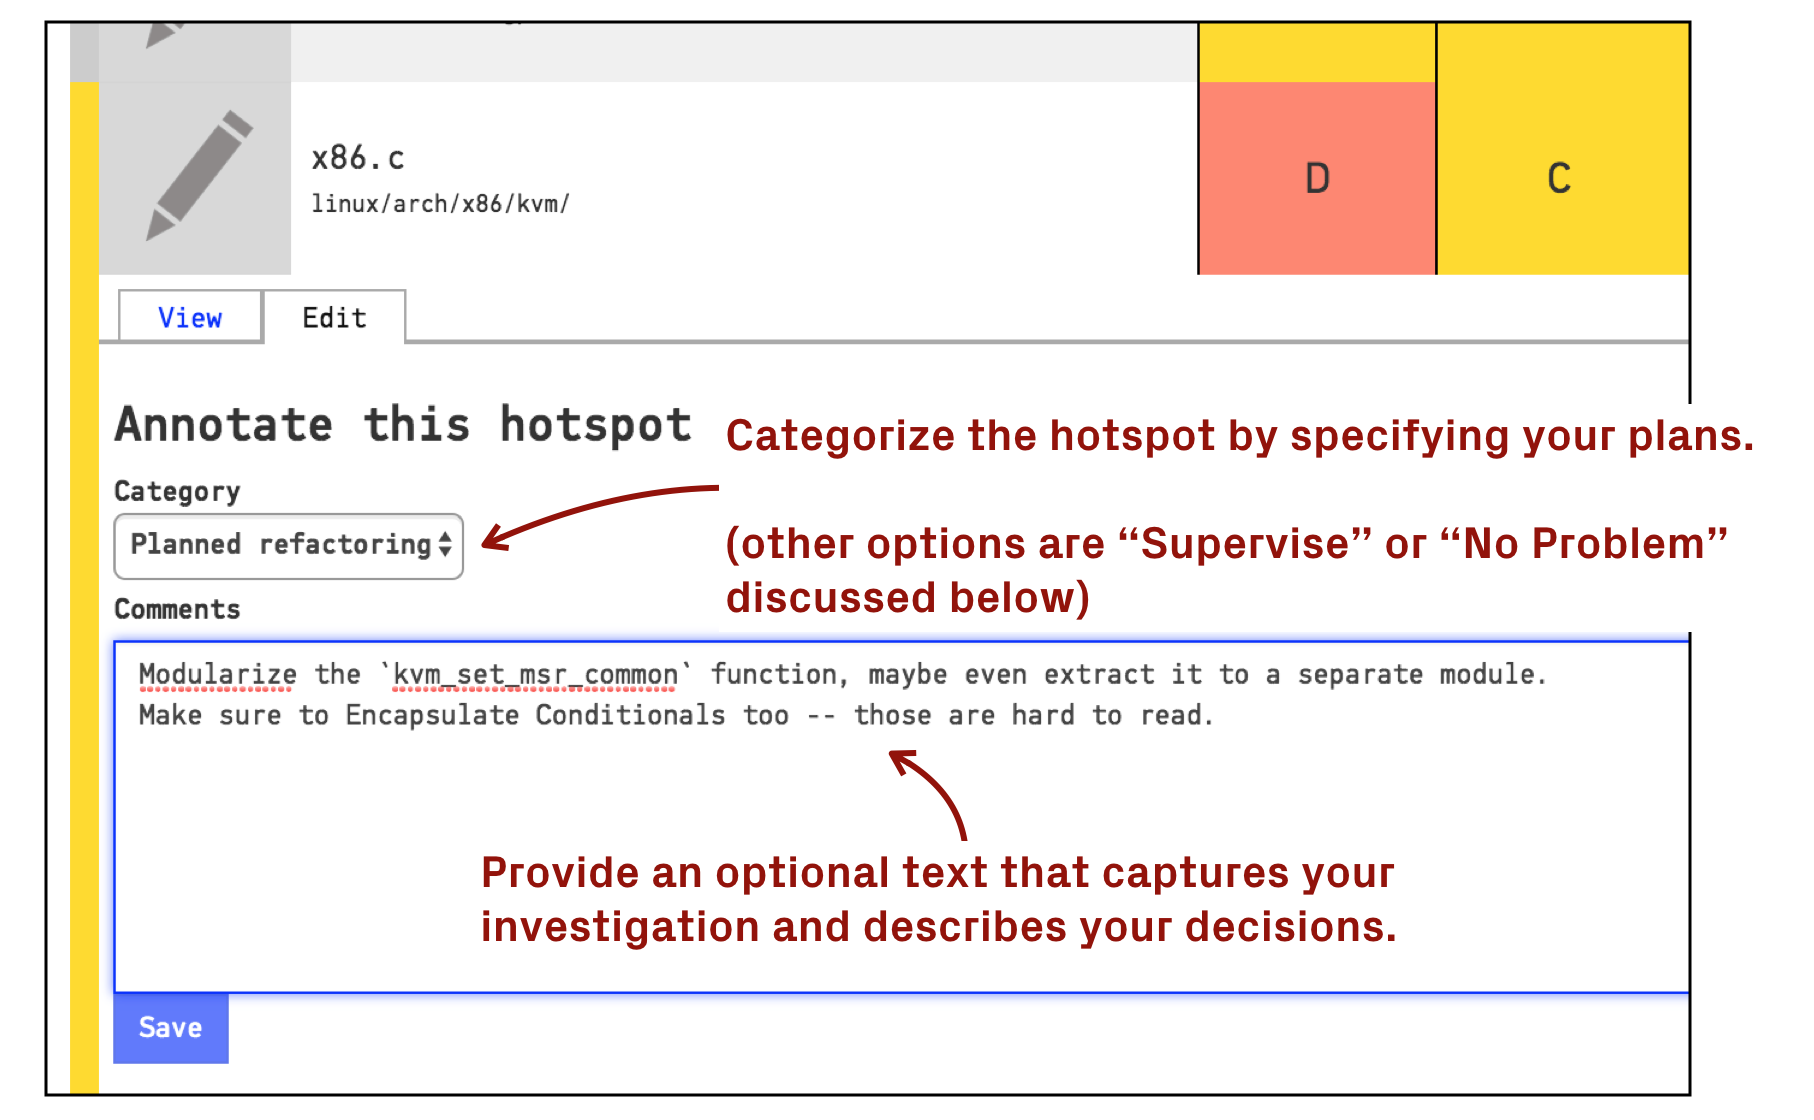
Fig. 64 Add an intelligent note to any hotspot in the Code Biomarkers view.
Display the Biomarkers Monitor
CodeScene presents an additional monitor view where the biomarkers are continuously updated with the status of your ongoing work. Present the view on a TV in the office and use the information to communicate a shared understanding on the state of the codebase as shown in Fig. 65.
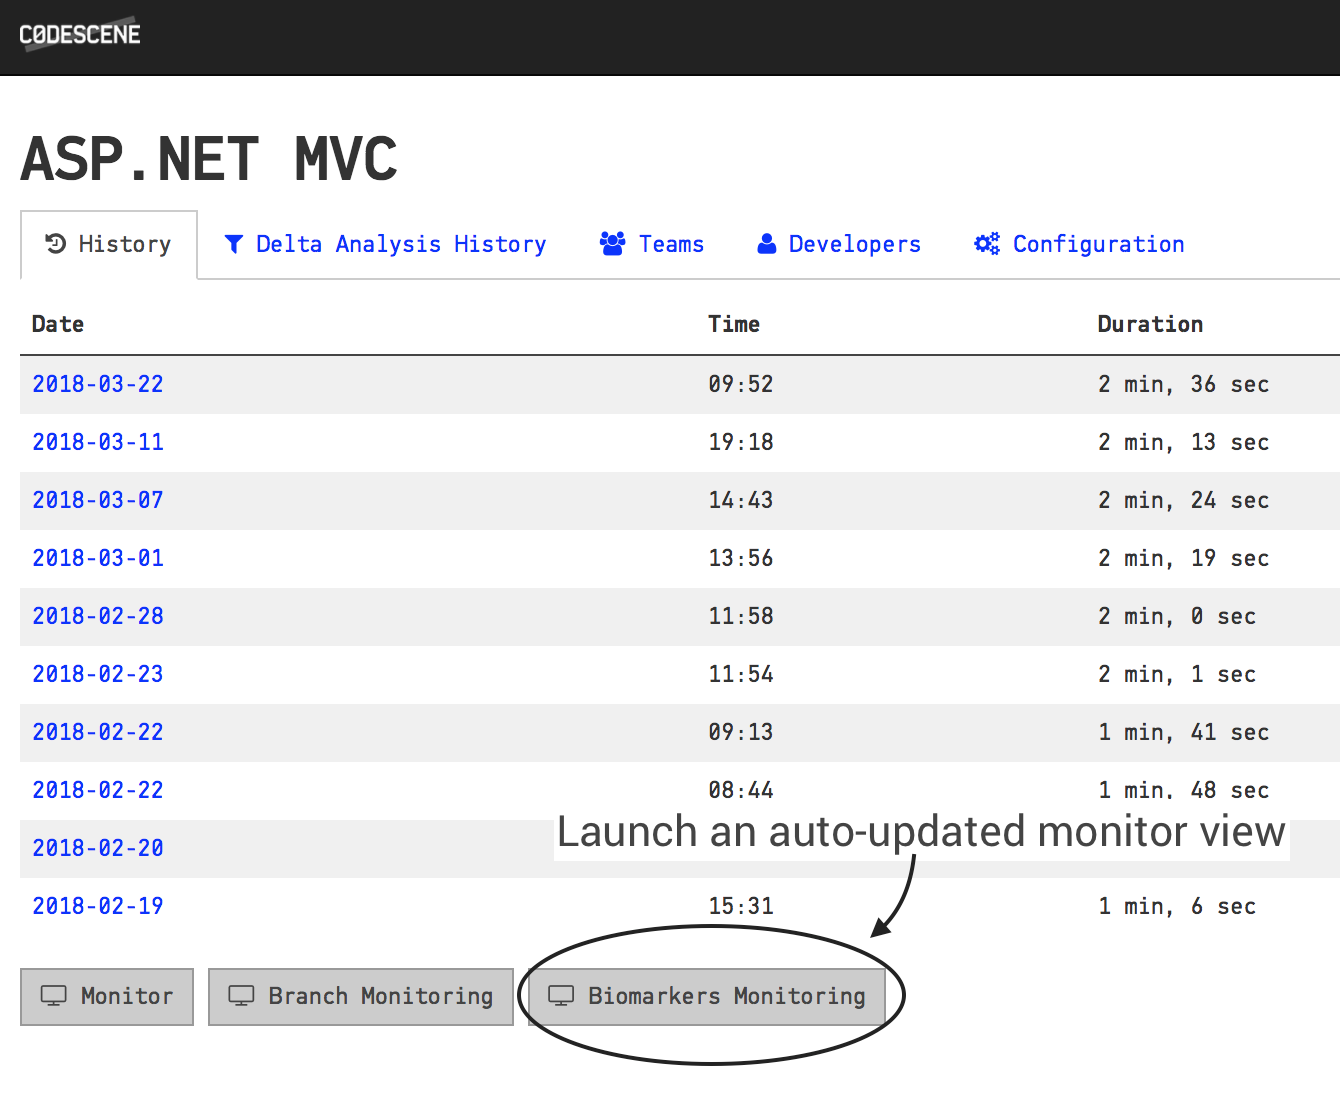
Fig. 65 Display an always up-to-date view of your biomarkers.
Auto-Detect Degrading Biomarkers with Continuous Integration
CodeScene’s delta analysis lets you supervise your code health as part of a continuous integration pipeline. This lets you auto-detect files that seem to degrade in quality through issues introduced in the current commit or pull request. See Use a Delta Analysis to Save Time in Code Reviews for more details.