Hands On Behavioral Code Analysis: CodeScene Use Cases
CodeScene is different from the traditional code analysis tools you might have come across earlier. So follow along as we explain how you use the analysis information and how you integrate CodeScene in your organization’s daily work to get the most out of the tool.
What is a Behavioral Code Analysis?
Behavioral Code Analysis was pioneered by the research and techniques from the books Your Code As A Crime Scene and Software Design X-Rays: Fix Technical Debt with Behavioral Code Analysis by Adam Tornhill, Empear’s founder.
The main difference between CodeScene’s behavioral code analysis and traditional code scanning techniques is that static analysis works on a snapshot of the codebase while CodeScene considers the temporal dimension and evolution of the whole system. This makes it possible for CodeScene to prioritize technical debt and code quality issues based on how the organization actually works with the code (we’ll give specific examples soon – promise).
In addition, CodeScene goes beyond code as it considers the organization and people side of the system. This gives you valuable information that is invisible in the source code itself, such as measures of team autonomy and off-boarding risks; factors that increase in importance with the scale of the development organization.
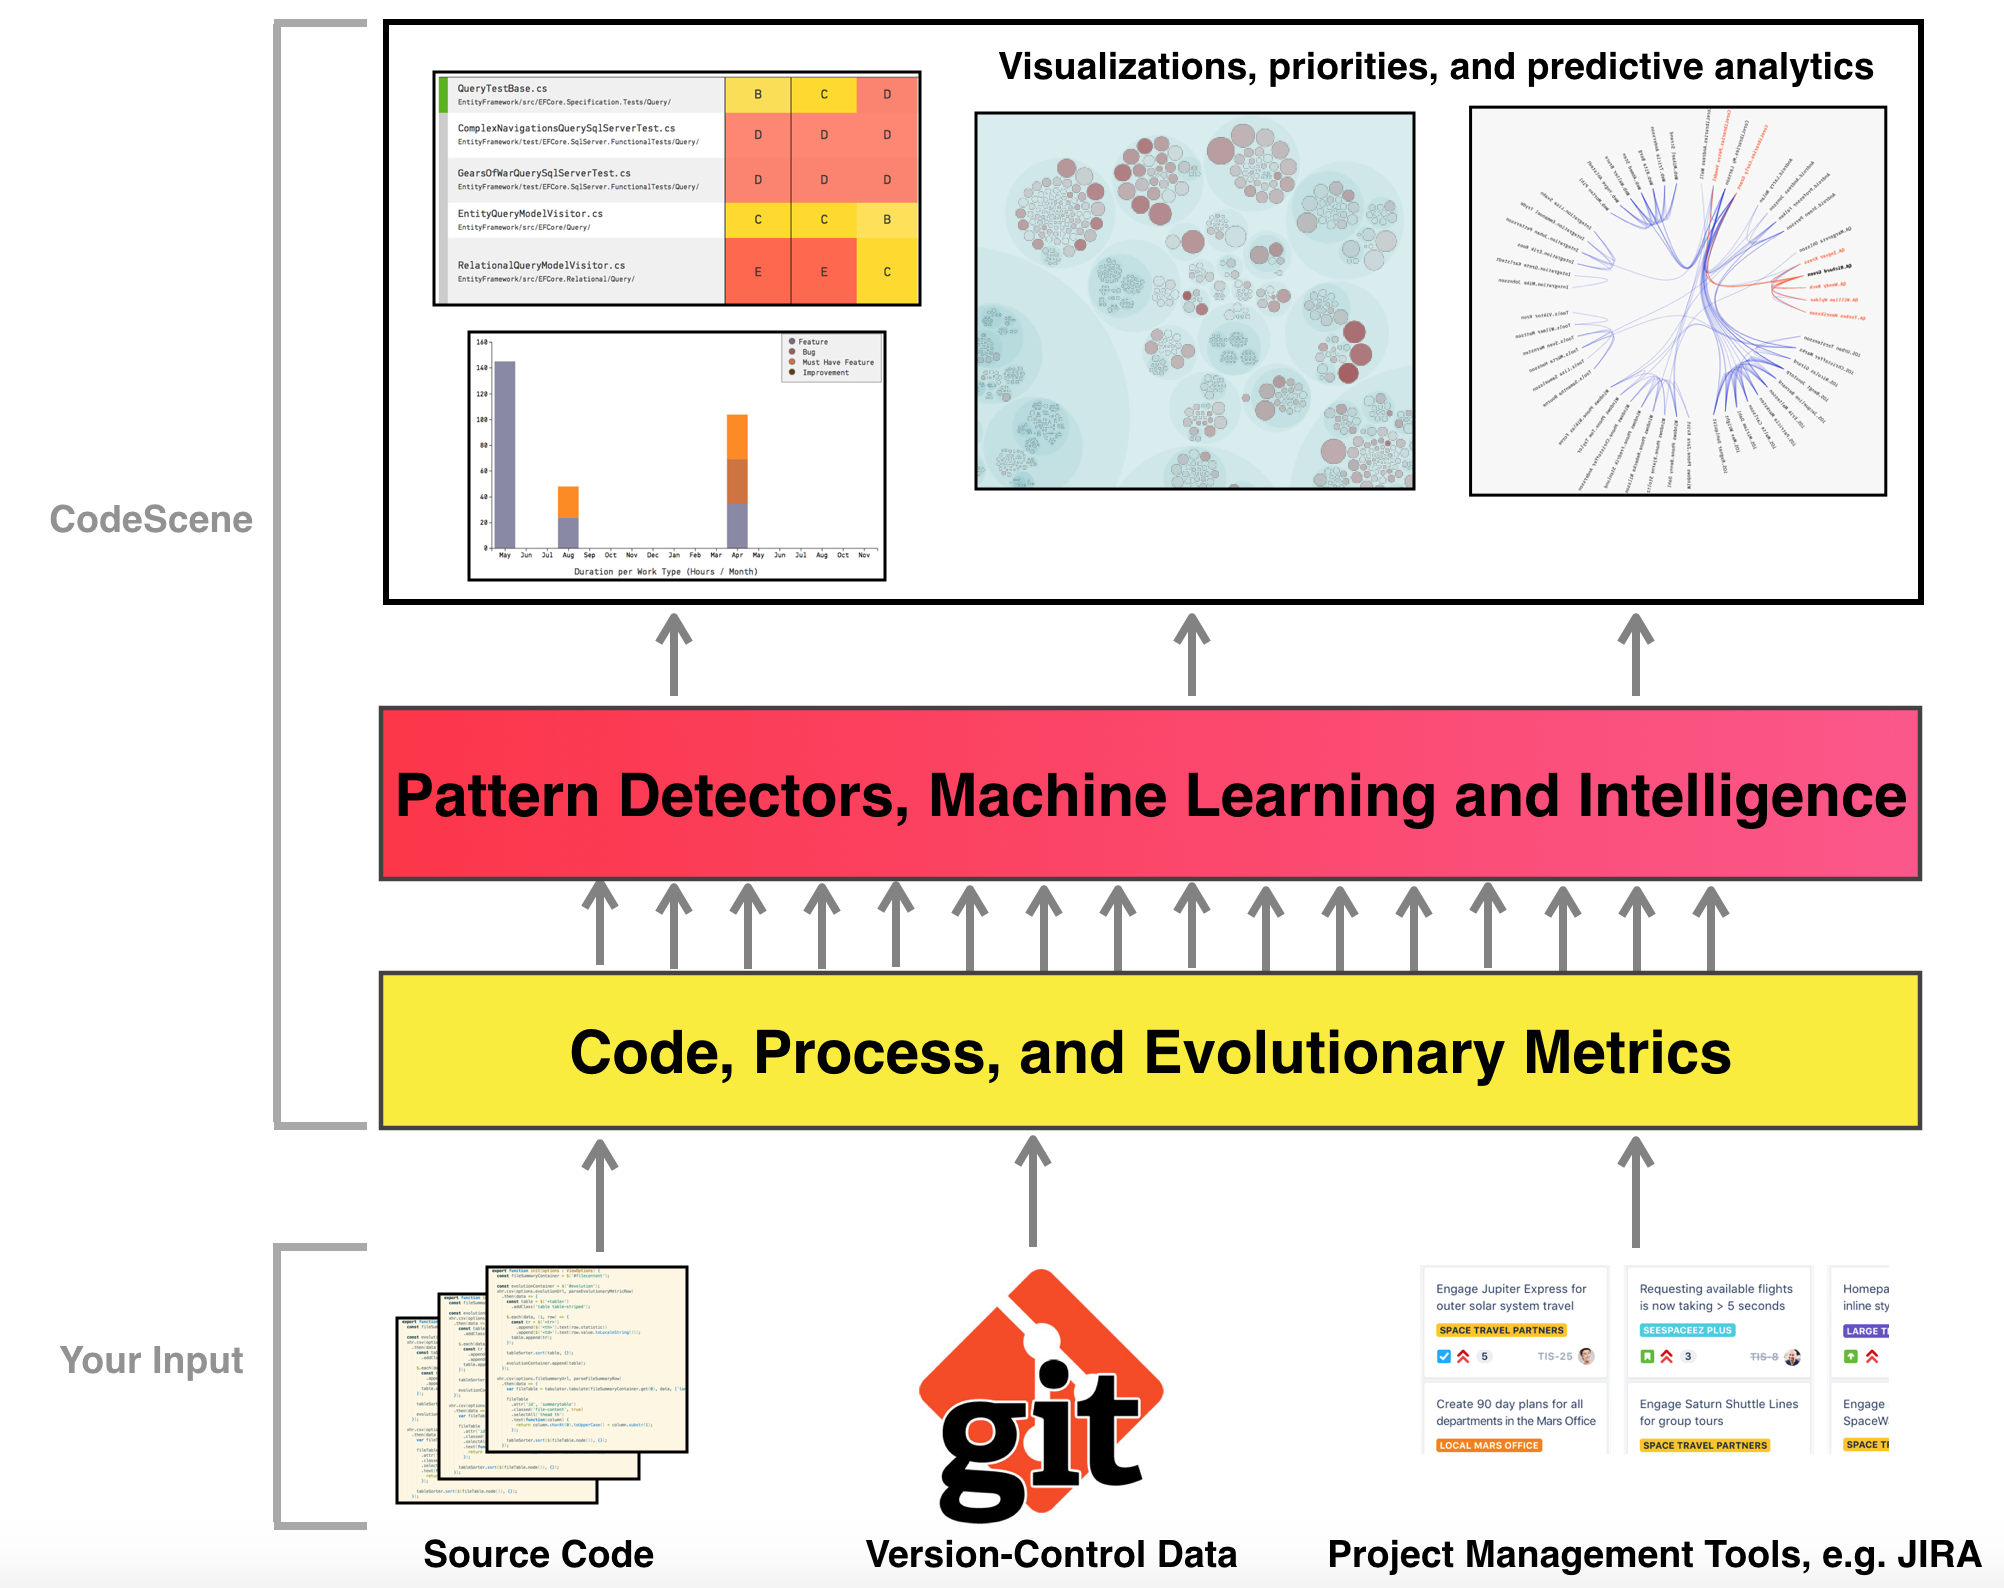
Fig. 19 Behavioral Code Analysis builds on two main data sources plus an optional integration with project management tools like Jira.
With the differences covered, let’s see how to get started.
The Two Main Use Cases for Behavioral Code Analysis
CodeScene is used for two main use cases that are independent of each other:
1. Optimize Your Software Delivery: CodeScene comes with all the tools and features you need in order to optimize your software delivery. This includes analyses to prioritize technical debt, measure improvements, detect delivery risks and inter-team coordination bottlenecks, and much more. This information is used regularly and, typically, integrated in your organizations daily work.
2. Ad-Hoc Strategic Analyses: Some analyses in CodeScene aren’t intended for daily use, but are there to support you when you need data to guide and support your decisions. These analyses include CodeScene’s Team Planning with the On- and Off-Boarding Simulation that lets you mitigate product risks, and CodeScene’s change coupling analyses (see Architectural Analyses that help you evaluate and optimize your software architecture based on how your system evolves.
In this tutorial we will focus on the first use case, and leave the second one to the Guides.
A Workflow to Manage Technical Debt
Most of the time you will navigate via the main analysis dashboard in CodeScene, shown in Fig. 20. To learn more about the dashboards, check out CodeScene’s Dashboards: The Status of Your Codebase at a Glance.
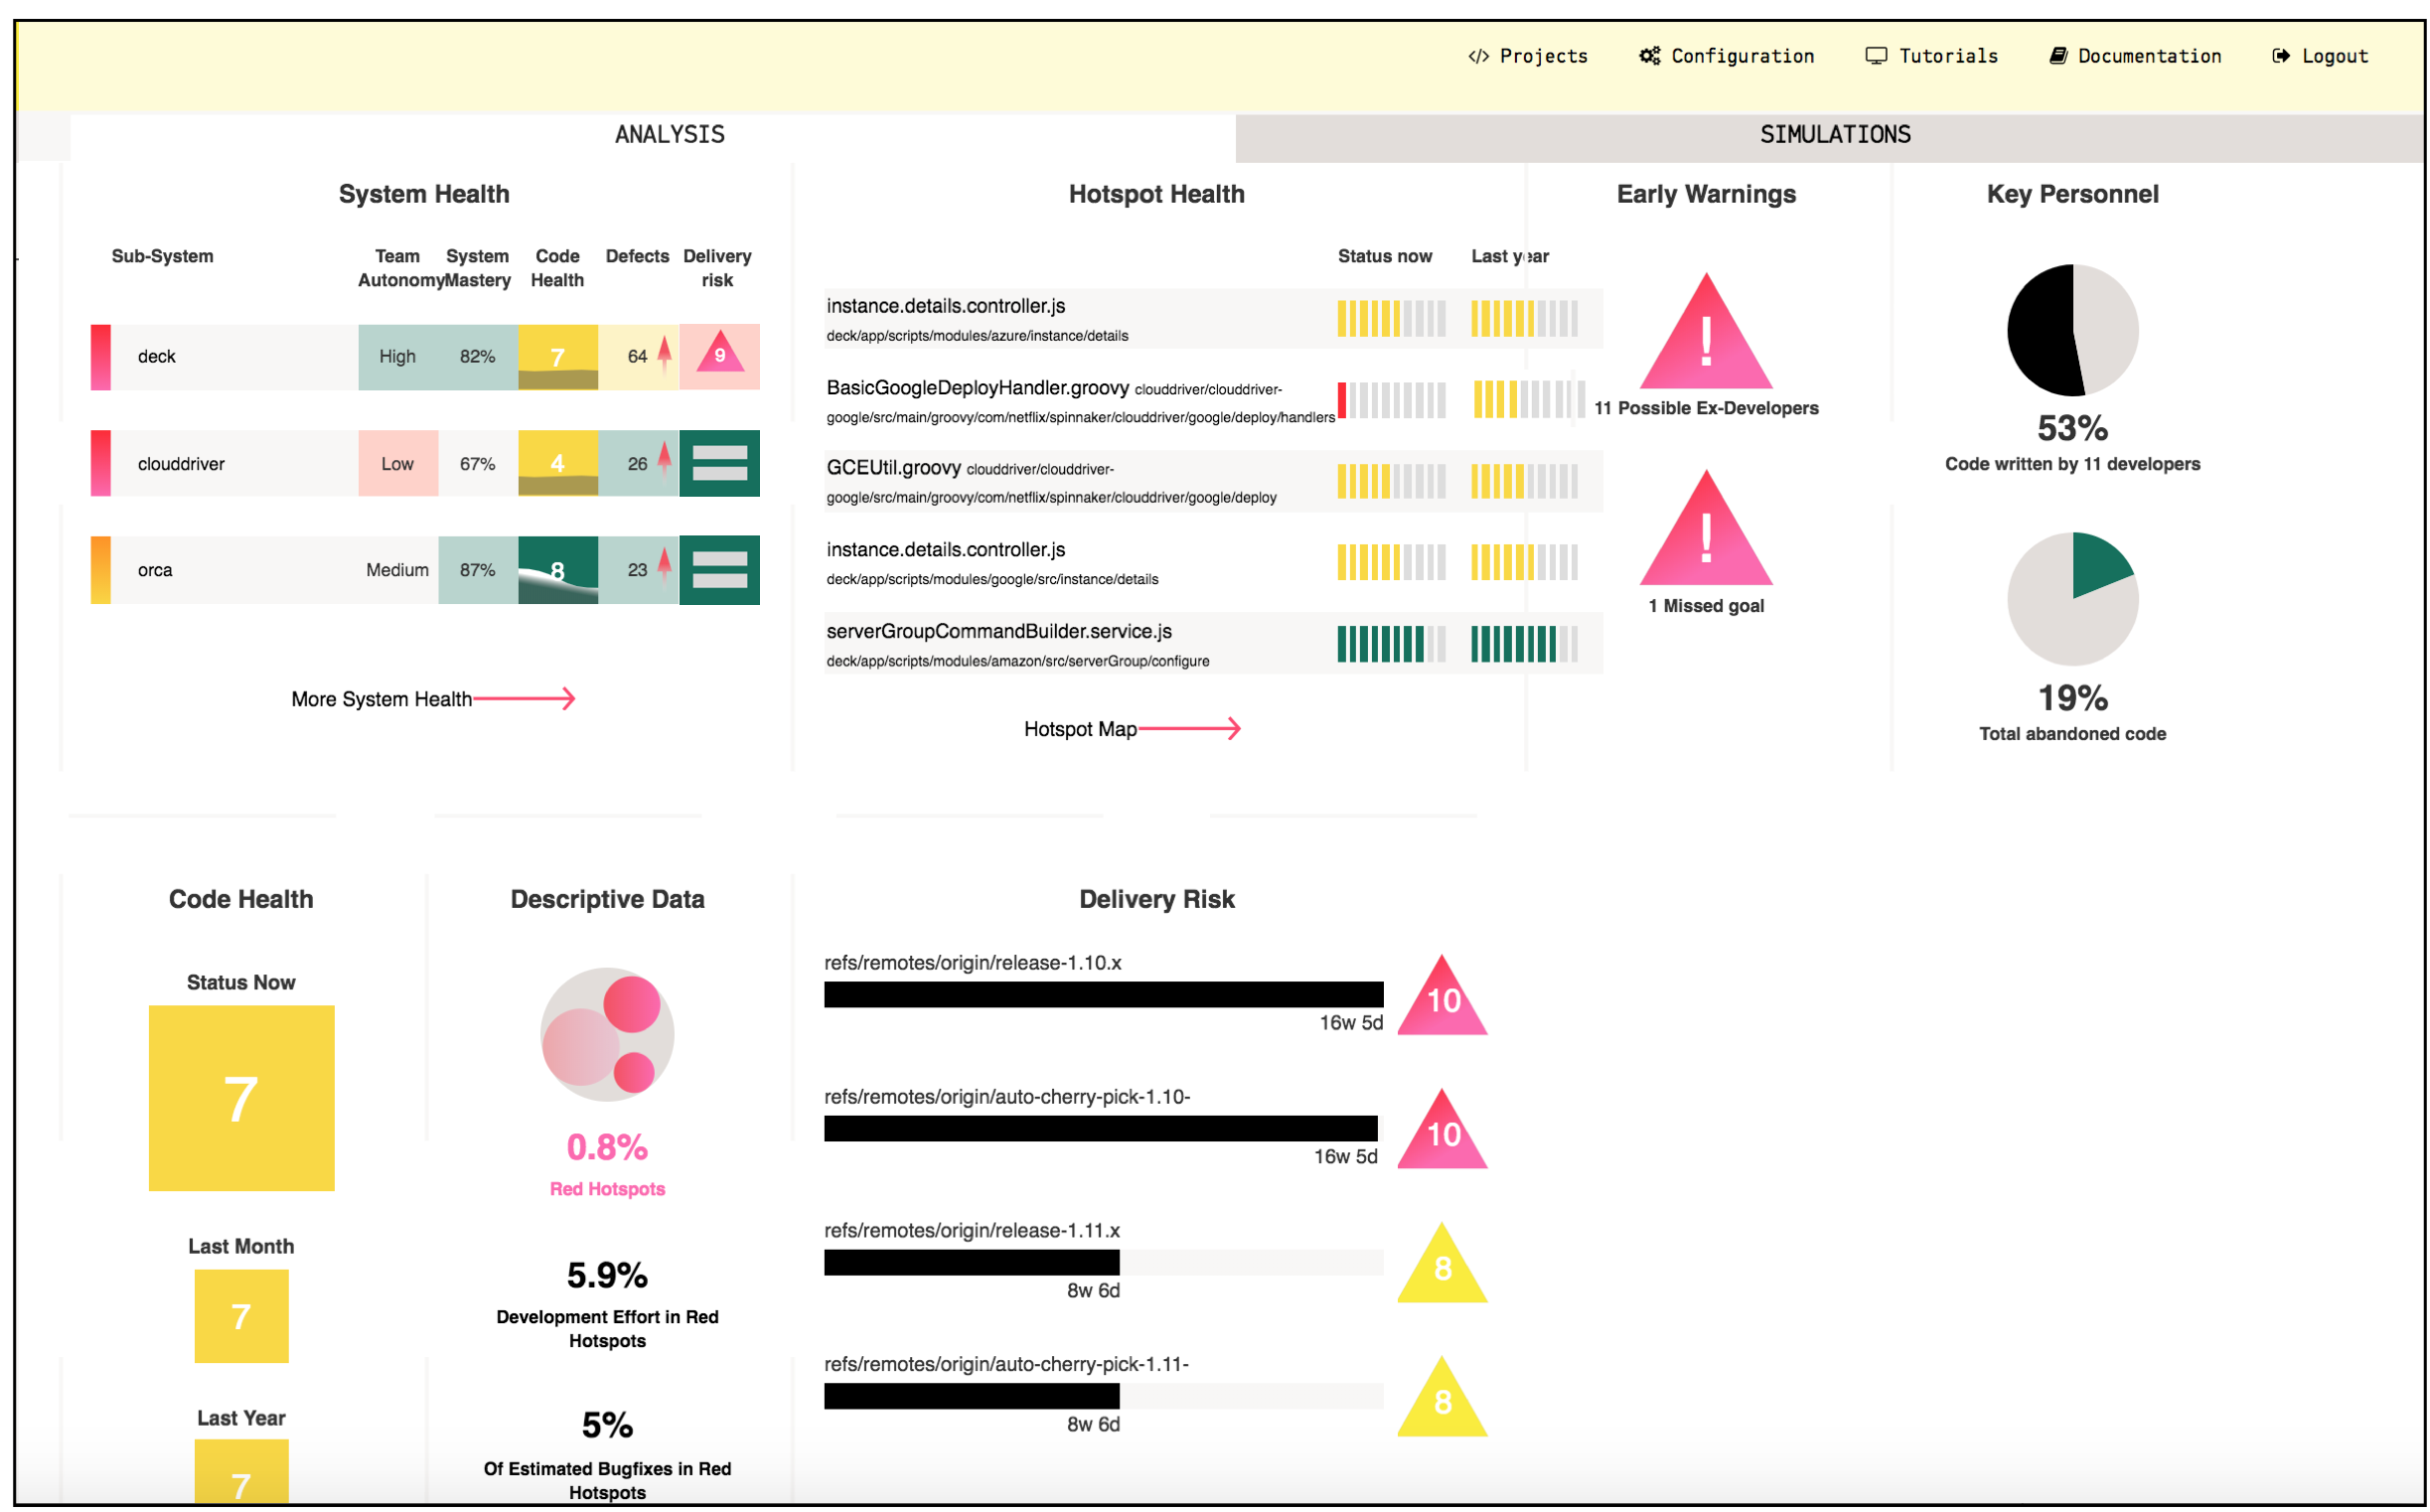
Fig. 20 CodeScene’s interactive analysis dashboard presents the key metrics at a glance.
However, you will use CodeScene differently the first times you run an analysis and start to explore a new codebase. Generally, a behavioral code analysis passes through three different stages:
1. The first time you analyse a codebase you spend some time building up a holistic overview of the code. As part of this stage, you use CodeScene to identify and prioritize technical debt. This stage is partly exploratory but CodeScene guides you along the way.
2. In the second stage your organization acts on the findings you have identified. You use CodeScene to follow-up and measure the effect of any code improvements or organizational changes to ensure you get a real – measureable – effect.
3. In the third stage, your technical debt is known, measured, and you use CodeScene to supervise it to ensure that no unexpected reckless debt is taken on. You might also use CodeScene to optimize your delivery by prioritizing code to review or direct testing activities based on CodeScene’s risk prediction algorithms.
All of these stages are reflected in CodeScene. Let’s start with the first one, technical debt prioritization.
Identify and Prioritize Technical Debt in Your First Analyses
We recommend starting by exploring your hotspots using the interactive map (see Hotspots), as shown in Fig. 21.
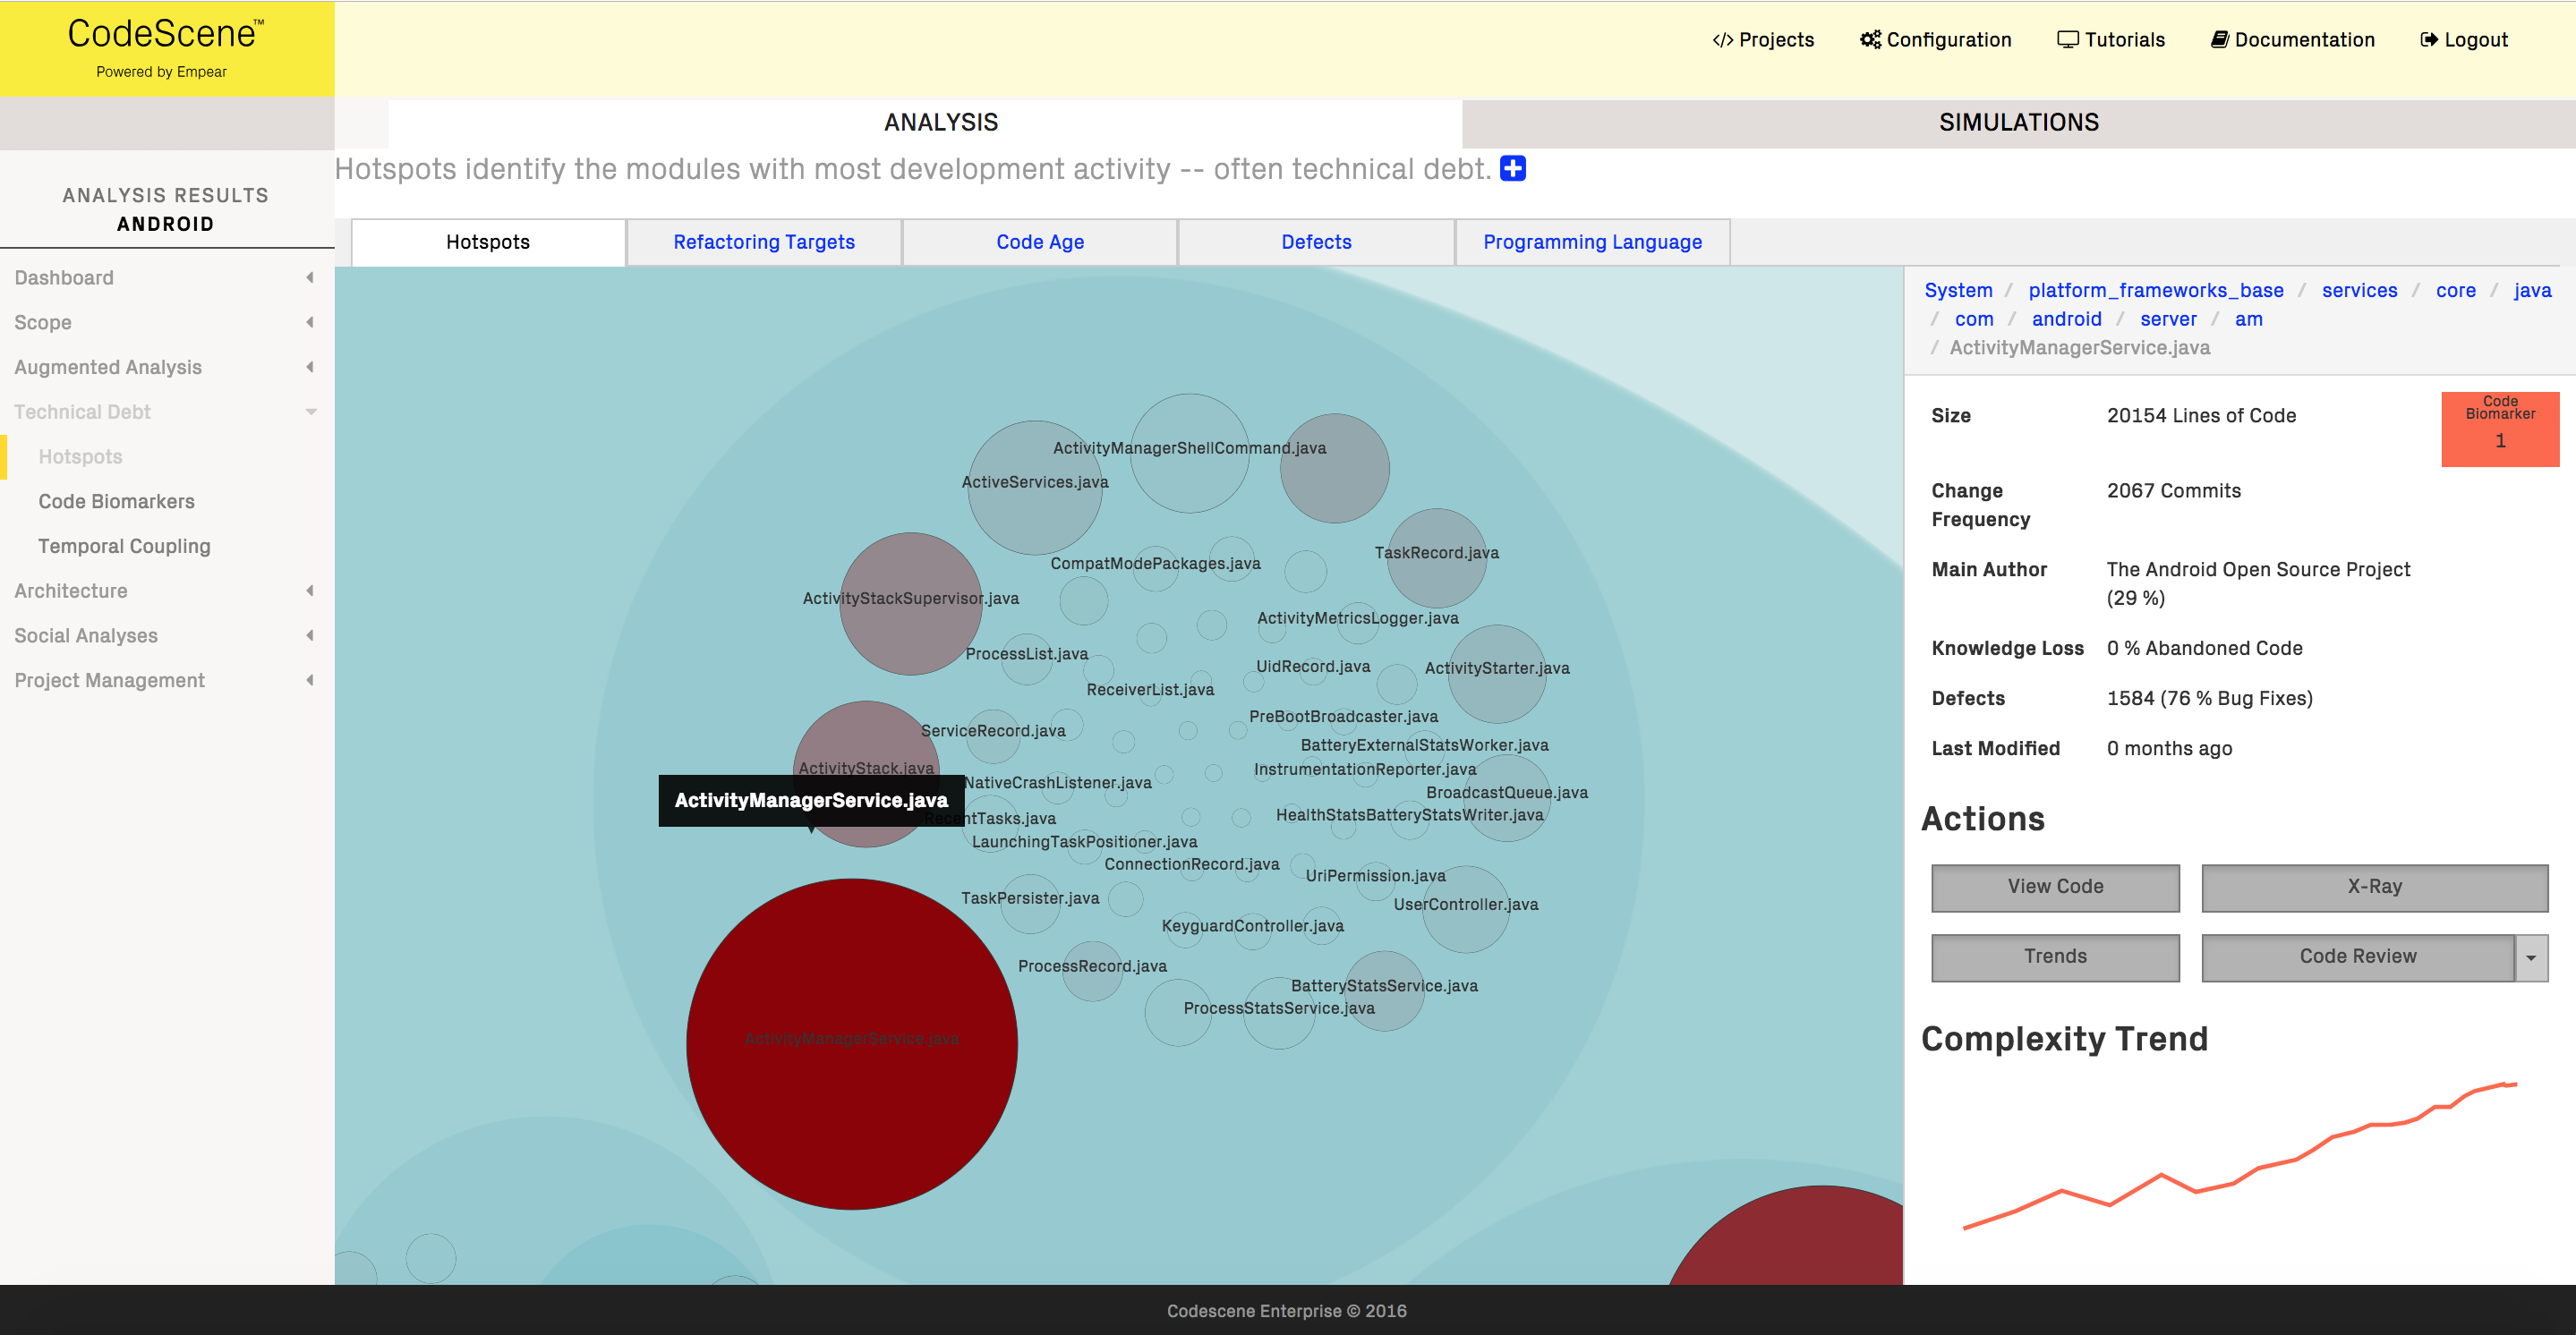
Fig. 21 Explore your codebase through the interactive hotspot map.
The interactive map helps you build a high-level mental model of what the code looks like. From there, you can zoom in on the hotspots. The Code Health score helps you make a quick assessment on the quality of the hotspot code. In general, if a hotspot’s Code Health is below 8, it’s worth digging deeper.
The reason you want to focus on hotspots is because they identify the parts of your code where most of your development activity is as measured by version-control data. You see an example in Fig. 22.
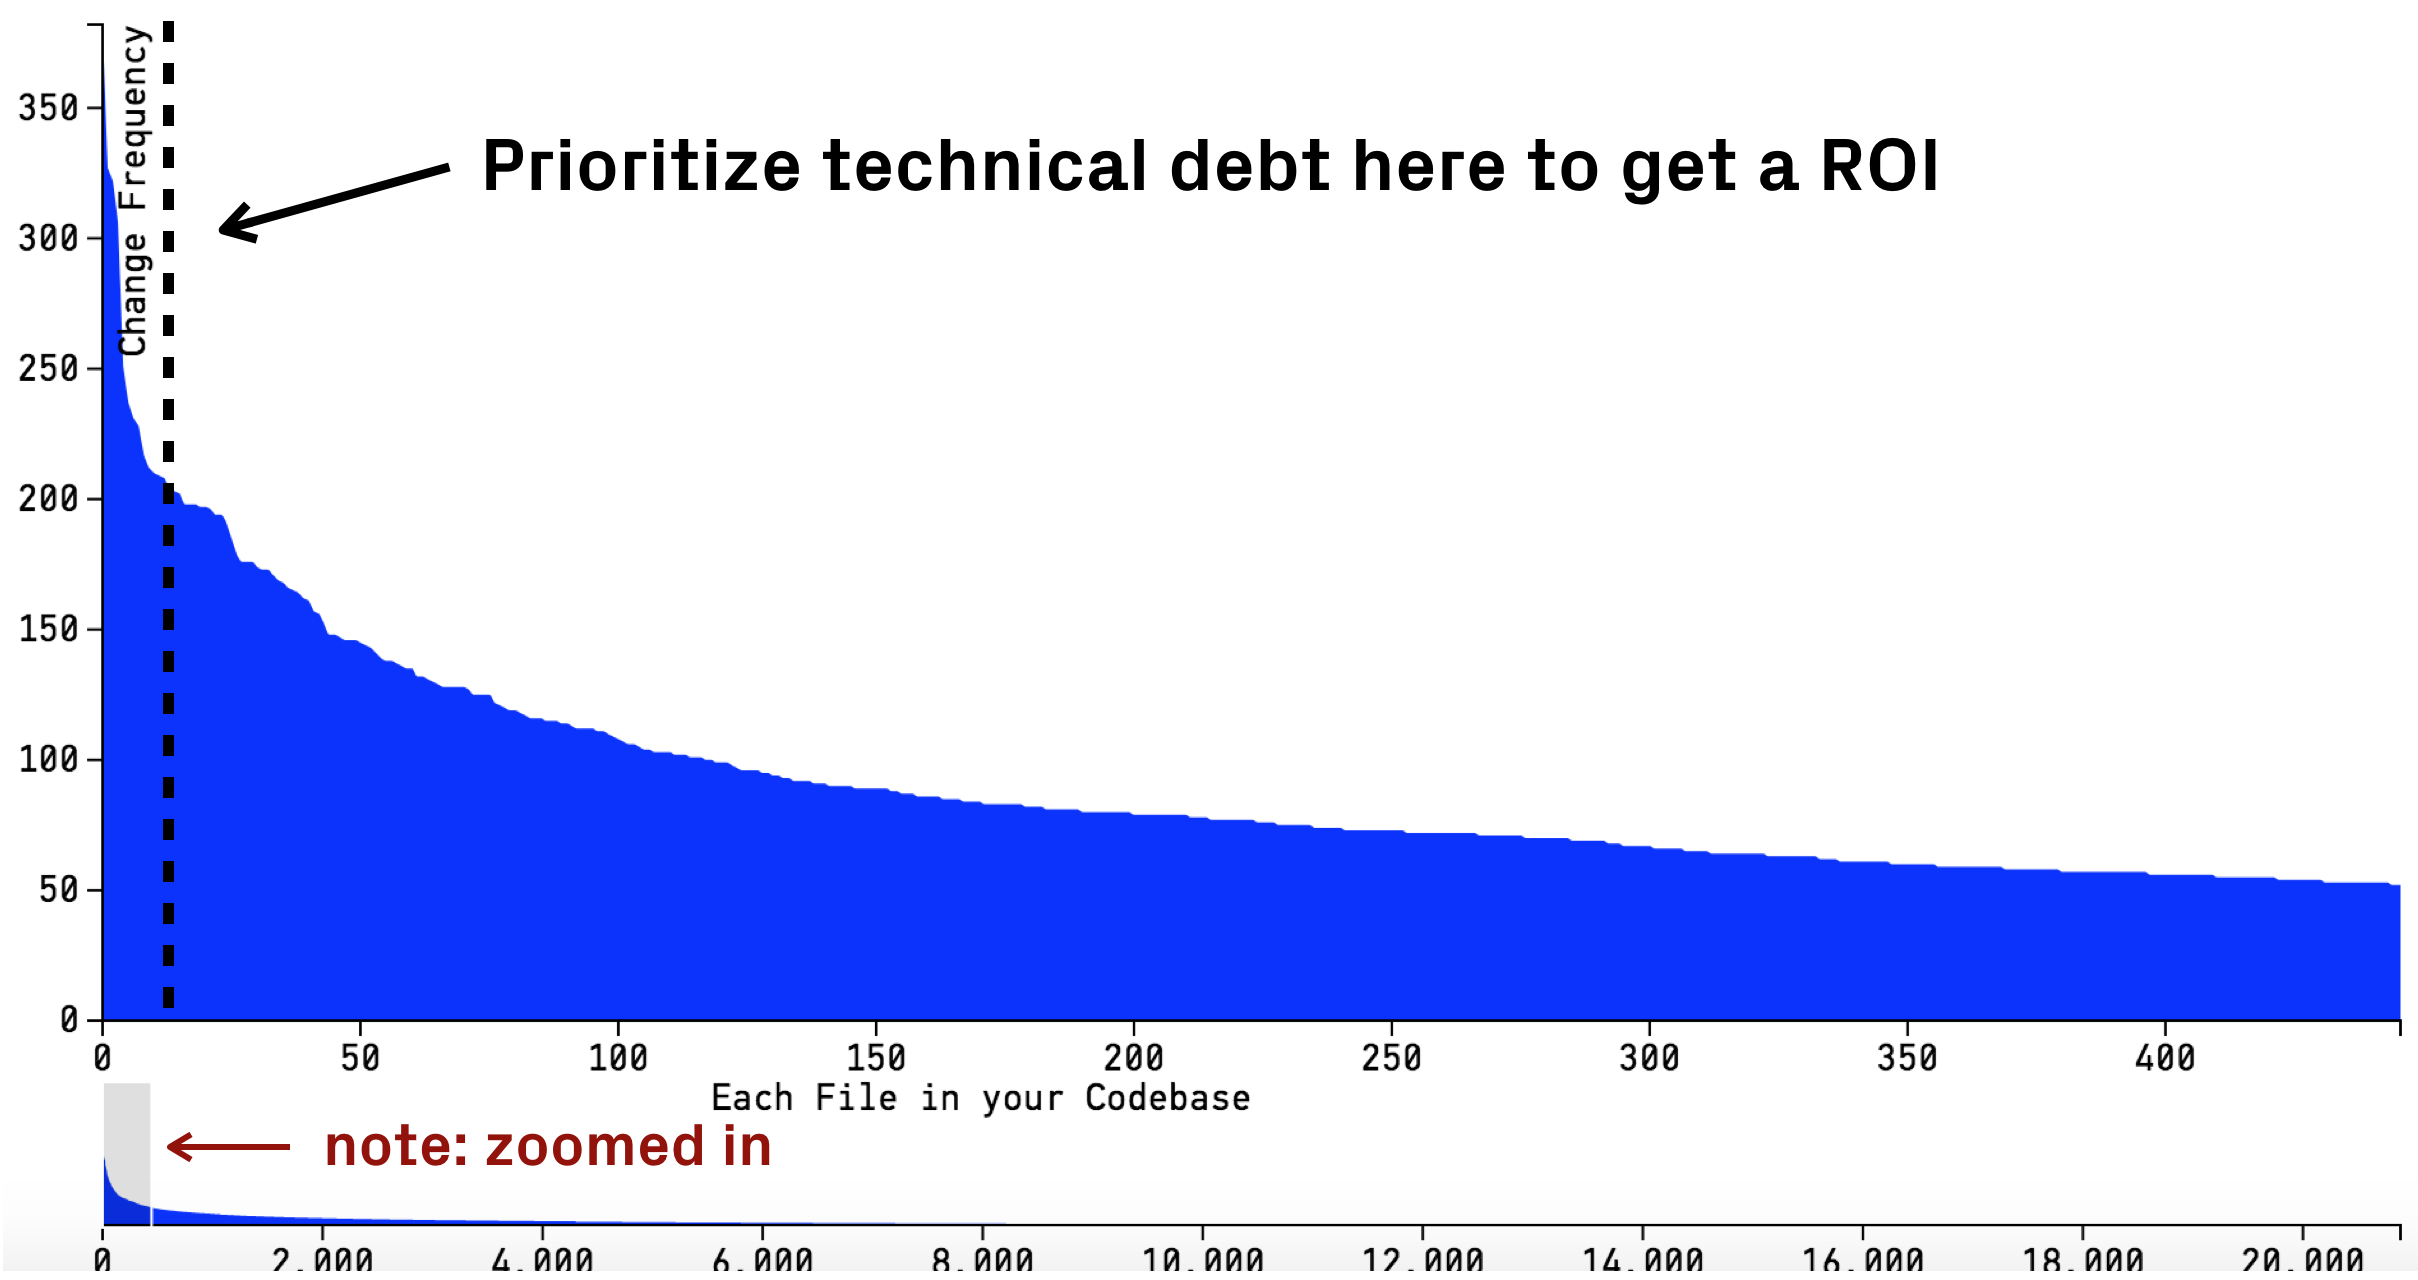
Fig. 22 All codebases evolve according to a power law, which means most development activity is in a relatively small part of the code.
Fig. 22 shows the change frequency of each module in a codebase. As you see, the change frequency forms a power law curve, and this is a pattern we at Empear have found in every single codebase we have analyzed; it is the nature of software evolution. What this means to you, is that most development activity is going to be in a relatively small part of your codebase. Hotspots identify those parts.
A hotspot is the code where most of your teams development activity is. Hence, any technical debt you might identify there is likely to have a high interest rate. Paying off the technical debt in a hotspot gives you the most return on code quality improvements.
Once you have identified your top hotspots, you act upon the findings. Let’s explore how CodeScene supports you in this stage.
Act on the Identified Technical Debt
Now, here’s an important aspect of hotspots: just because a piece of code is worked on frequently, that doesn’t mean it’s a problem. If you inspect your top hotspots and the code in them looks good, then you are in a very good position; the code you work with the most is healthy, which means it’s easy to evolve and understand. However, more often than not, the opposite tends to be true.
To find out if there is any technical debt in your hotspots, you request a Virtual Code Review (see Code Biomarkers–A Virtual Code Reviewer aware of Code Health). You then run an X-Ray analysis to get specific, actionable findings in case the identified hotspot is a large file (see X-Ray). Fig. 23 shows one example.
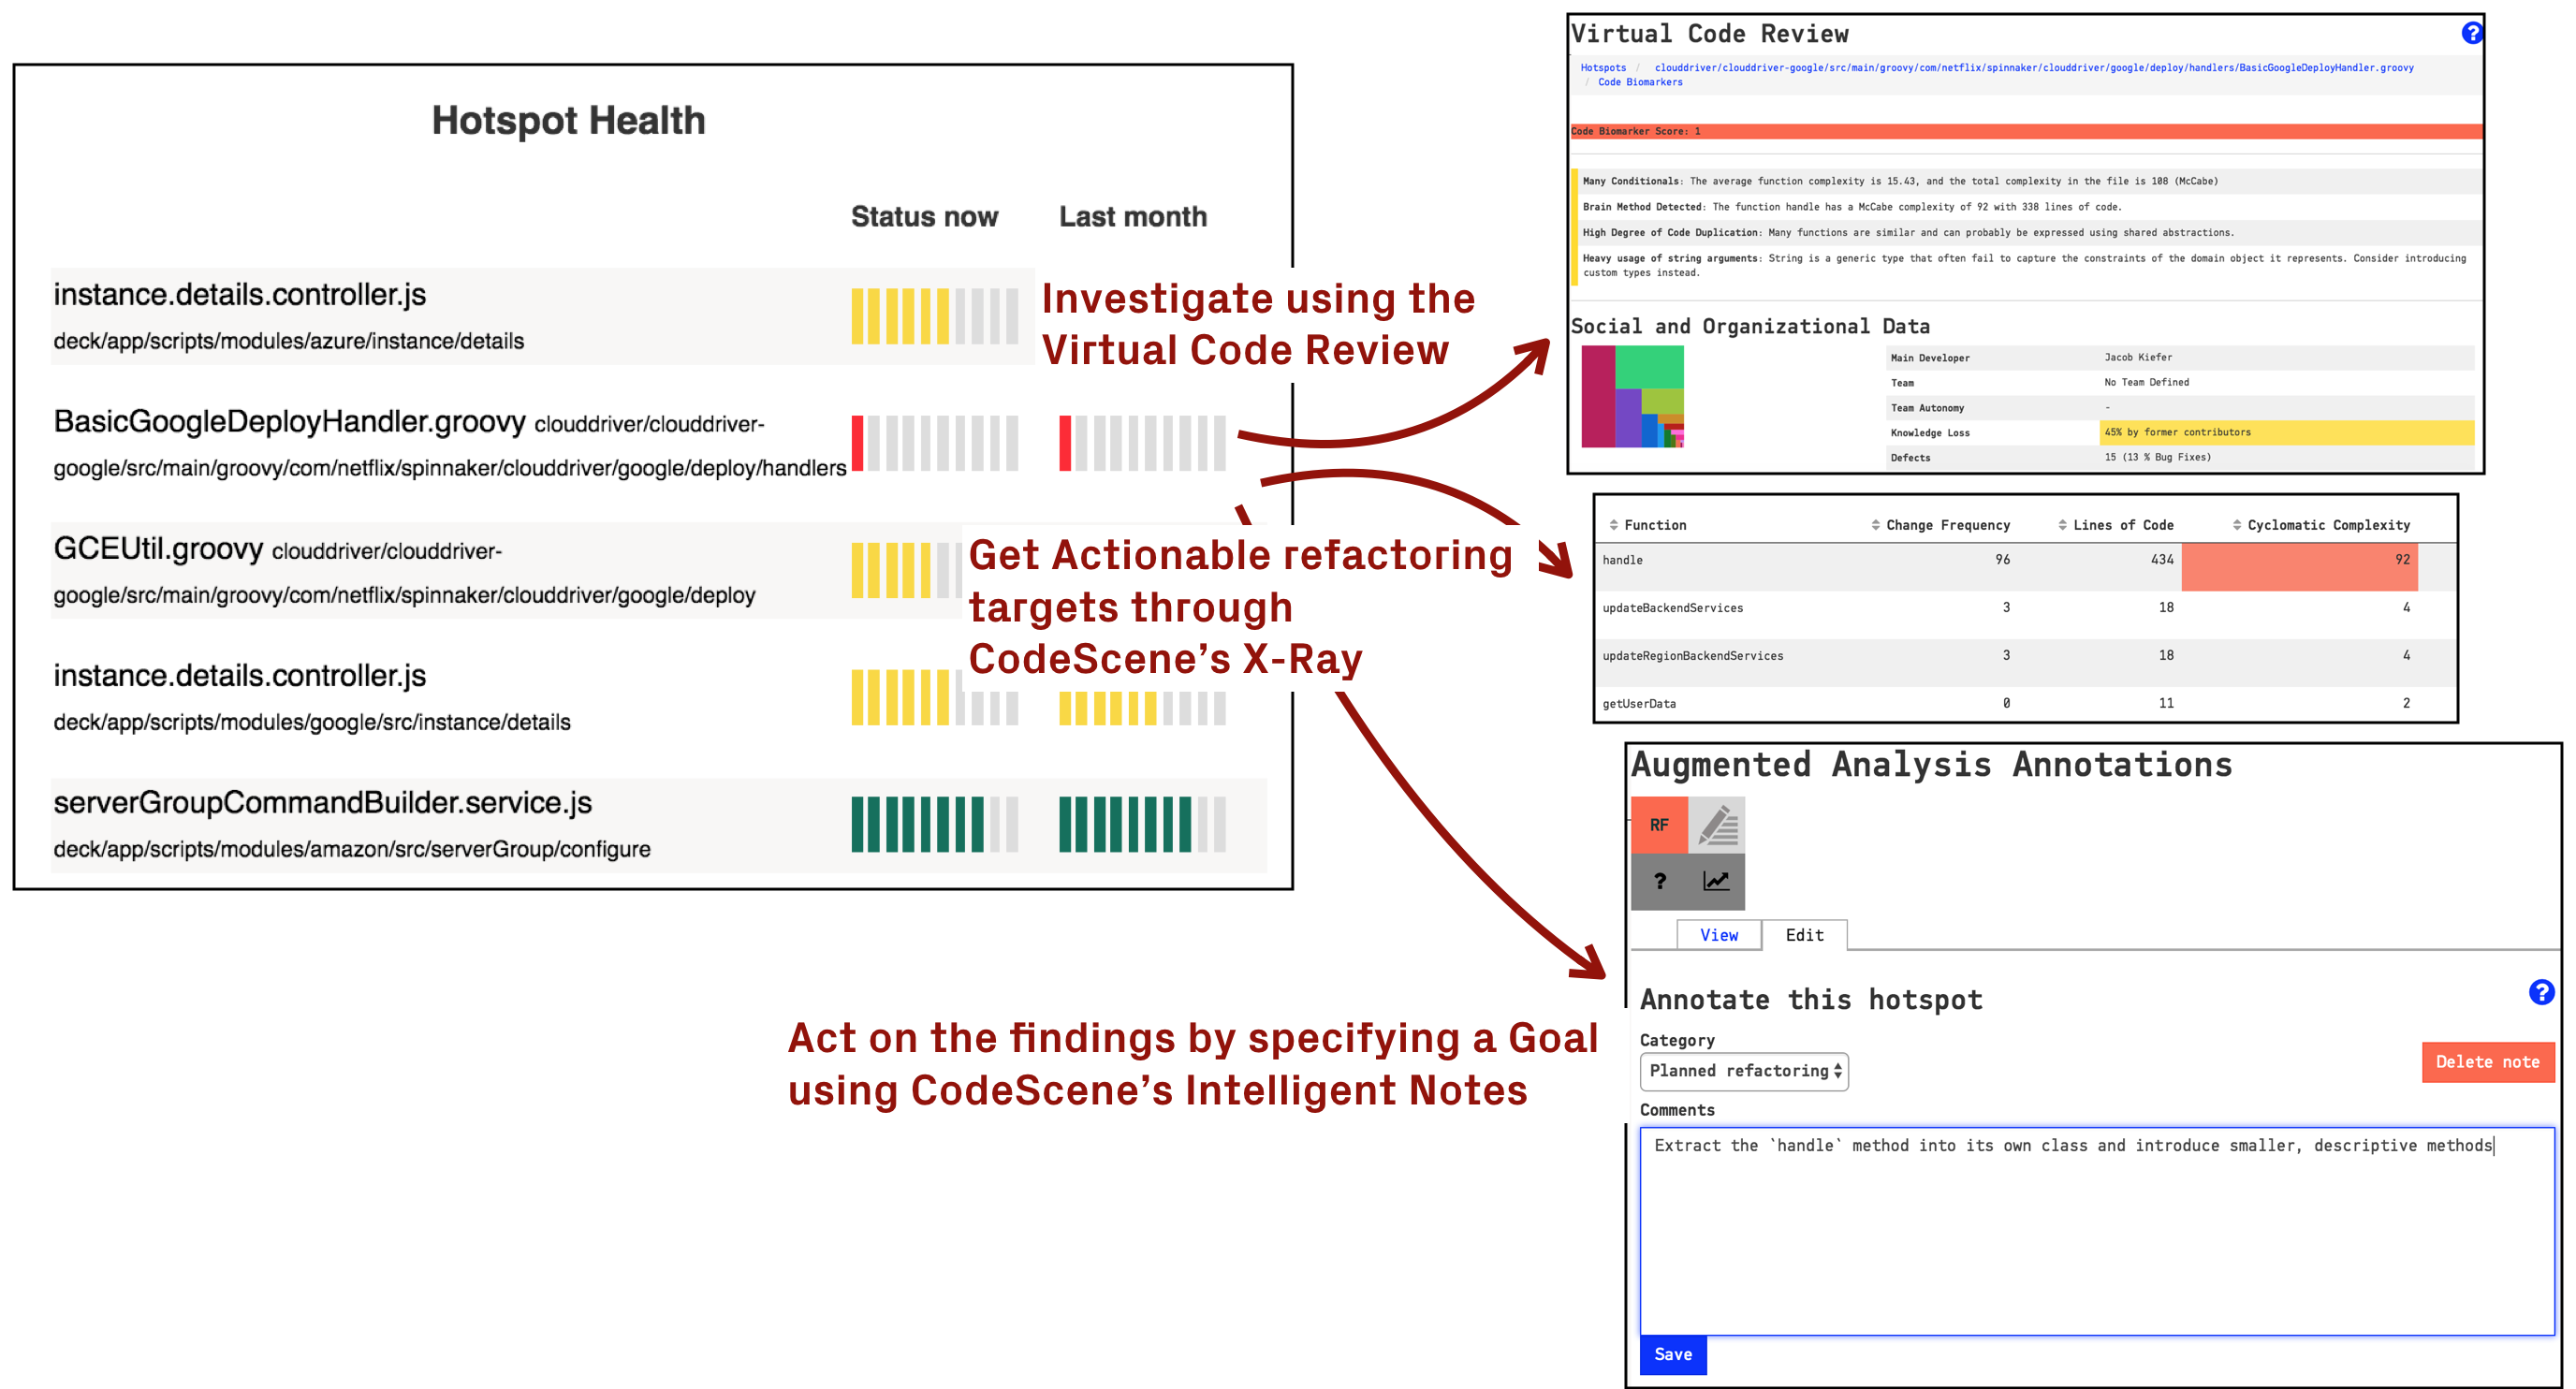
Fig. 23 Act on the hotspots by using the deeper analyses, and capture the outcome of your investigation in a goal.
Using CodeScene’s Code Health score, you get a quick assessment on how healthy the code is. A low health, e.g. anything below `7, is likely to be expensive in terms of future development as any technical debt in a hotspot comes with a high interest rate.
The key is to use CodeScene to dive deeper into a hotspot, and then capture the outcome of your investigation in a goal. Goals are specified using CodeScene’s Intelligent Notes, which is a core concept that makes technical debt both transparent, contextual, and – most important – actionable.
Specify Goals for each hotspot using CodeScene’s Intelligent Notes – the Goals enable several other important features.
Intelligent Notes are described in detail in Manage Hotspots and Technical Debt with Goals. Use goals to classify each hotspot as either:
- code that needs to be cleaned-up (Plan Refactoring),
- code that might have issues, but is good enough for now. We just want to ensure it doesn’t get worse (Supervise), or
- code that is OK as-is, so you no longer wish to see it as a hotspot unless something dramatic happens to the code (No Problem).
Whatever goal you specify, CodeScene will supervise those goals and inform you on their progress. Let’s see some examples.
Track and Visualize the State of your Technical Debt
As soon as you specify one or more goals, CodeScene will start to measure against them. You will see a high-level summary on the dashboards, and also get specific reports on each hotspot as shown in Fig. 24
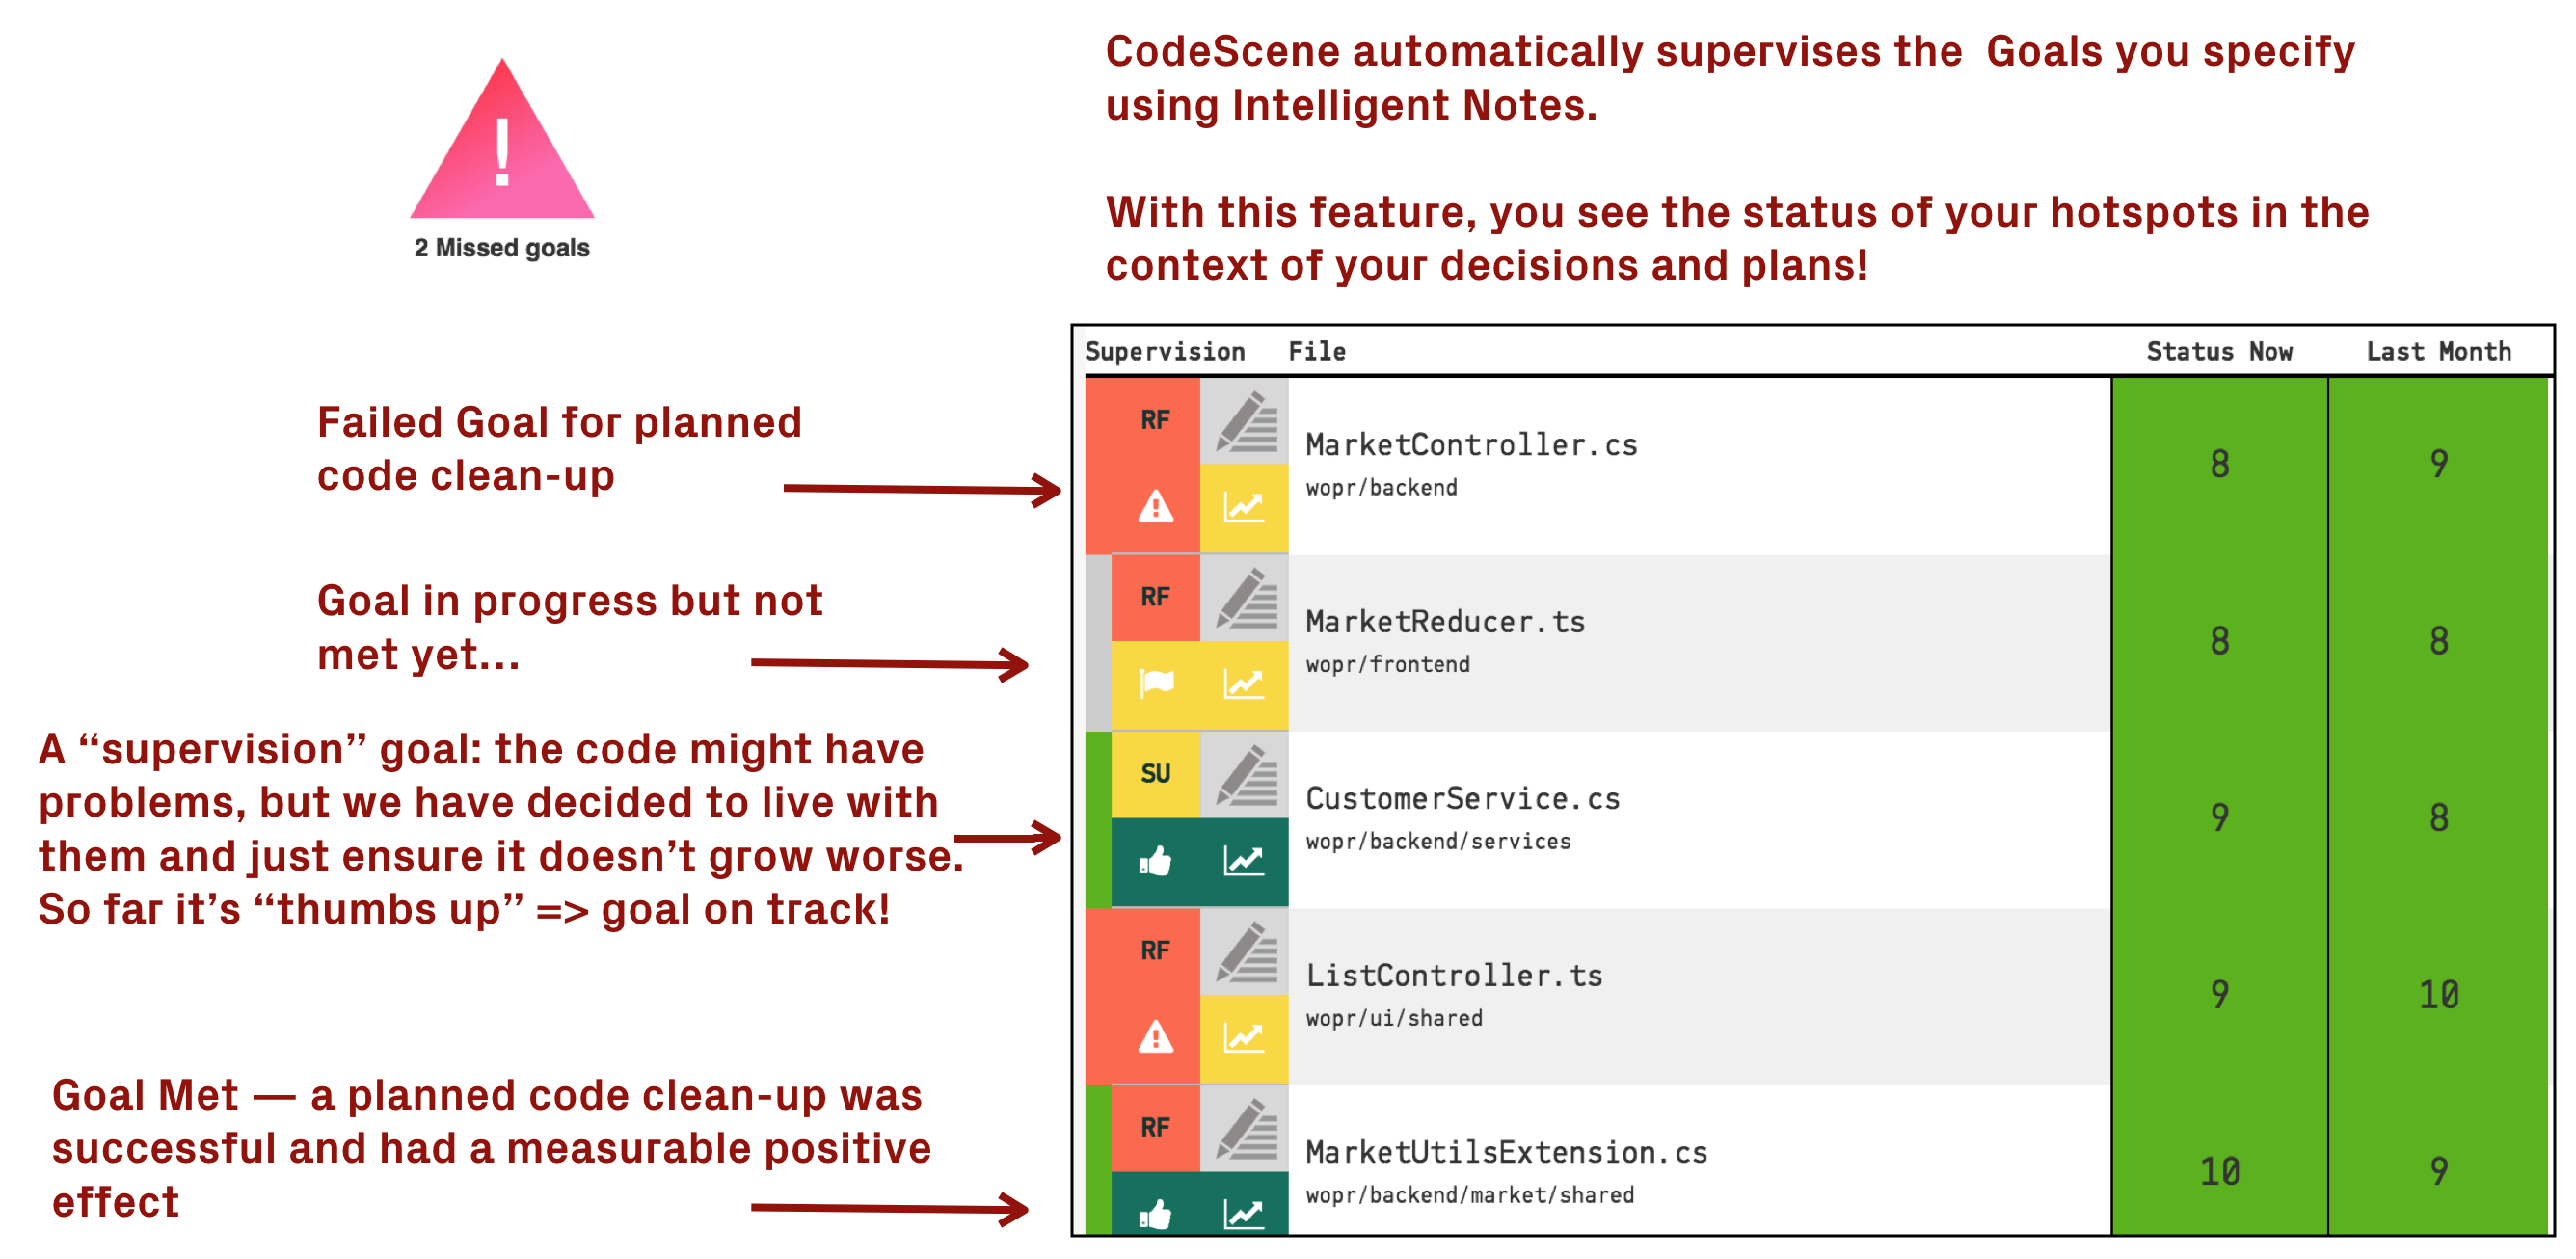
Fig. 24 Goals let you see the status of your hotspots in the context of your decisions and plans.
With the assistance of Intelligent Notes, you will see the status of your hotspots in the context of your decisions and plans. CodeScene will also present a warning on the analysis dashboard in case a goal is violated. However, feedback loops should be short so CodeScene offers additional warnings. Let’s look briefly at how you integrate this in a Continuous Integration/Delivery pipeline.
Supervise Your Goals with CI/CD Quality Gates
The earlier you can react to any potential problem or surprise, the better. That’s why CodeScene offers integration points that let you incorporate the analysis results into your build pipeline (see CI/CD Integration with CodeScene’s Delta Analysis).
Integrate CodeScene in your build pipeline to supervise your goals and prevent that unplanned technical debt is taken on.
The CI/CD integration triggers a special type of analysis called a delta analysis. A delta analysis is quick. The main purpose of this integration is to:
- Predict the delivery risk of a specific change set in order to prioritize code reviews and testing activites.
- Supervise your goals using Quality Gates to ensure that none of the goals you have specified via Intelligent Notes are violated.
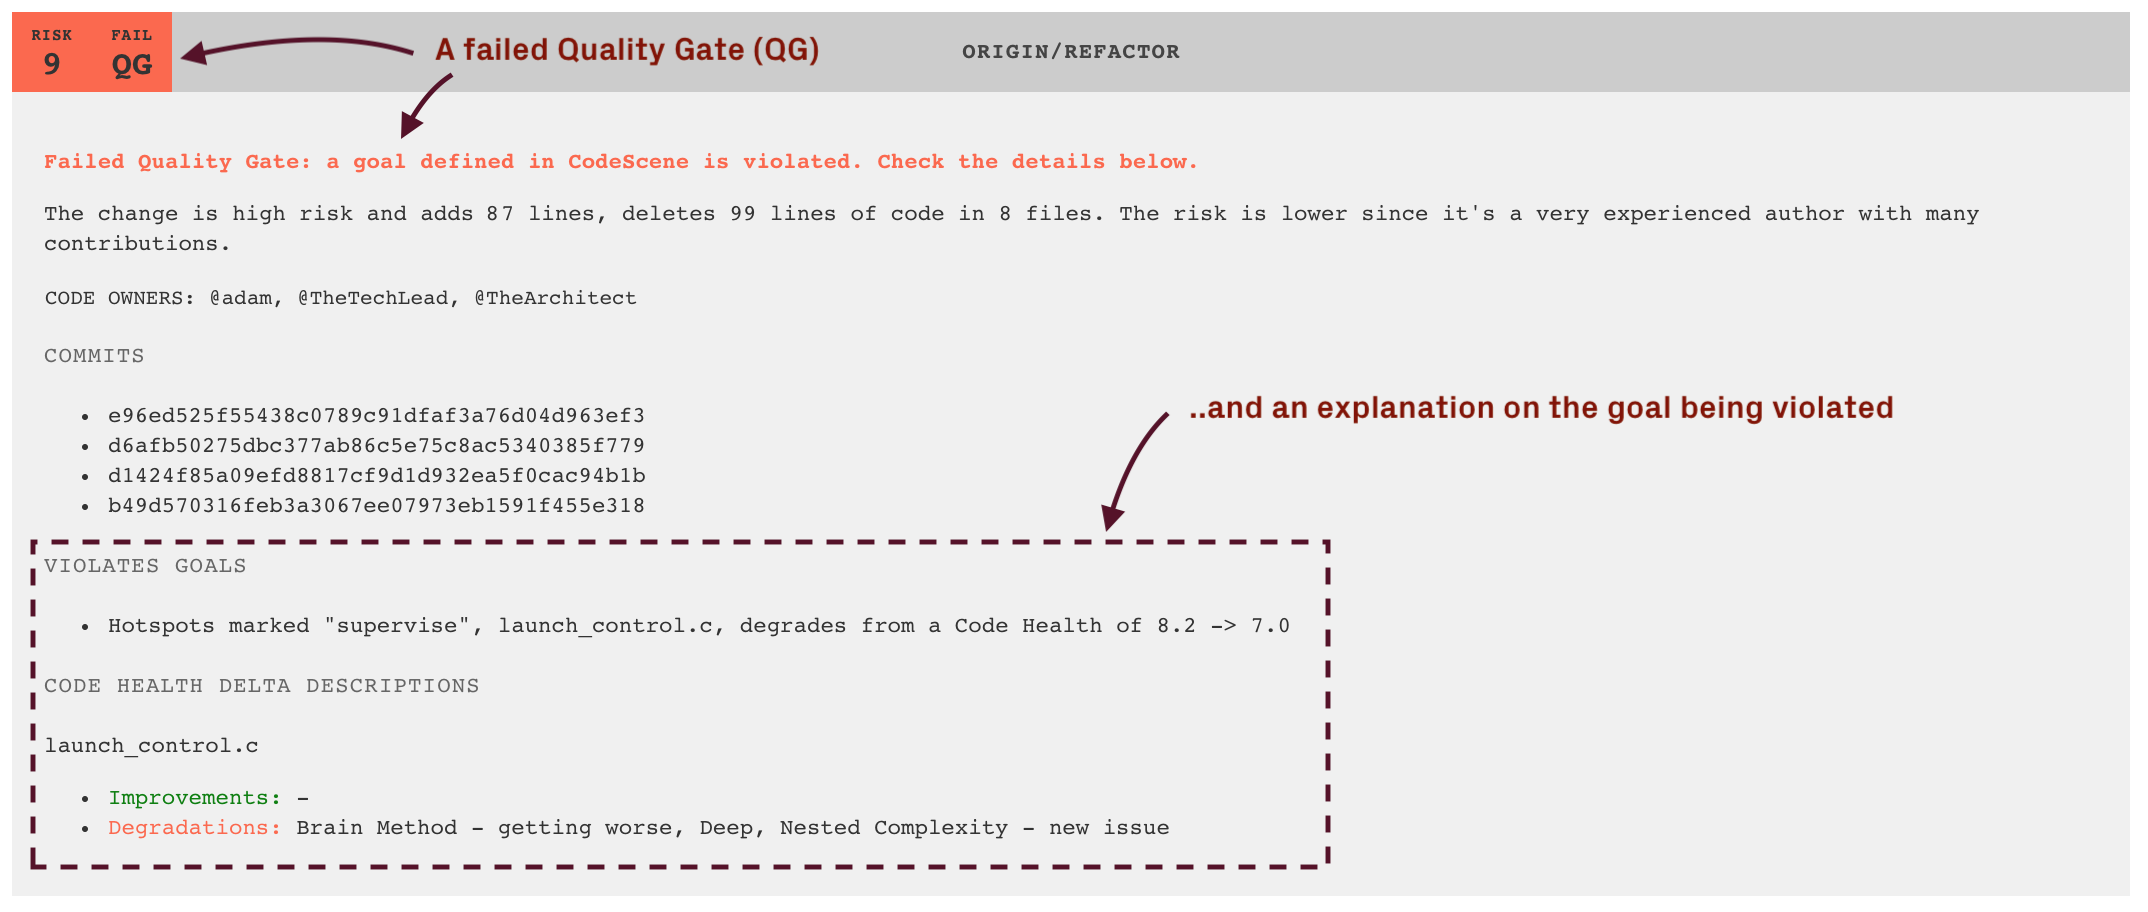
Fig. 25 Your goals are supervised in the CI/CD pipeline.
That way, violated goals can be detected before they become an issue. In addition, the status of your goals is also presented on CodeScene’s inter-product dashboard. Let’s look at an example.
Track Multiple Codebases and Products on the Inter-Project Dashboard
CodeScene also presents an inter-project dashboard that gives you a high-level overview of all your products, as shown in Fig. 26.
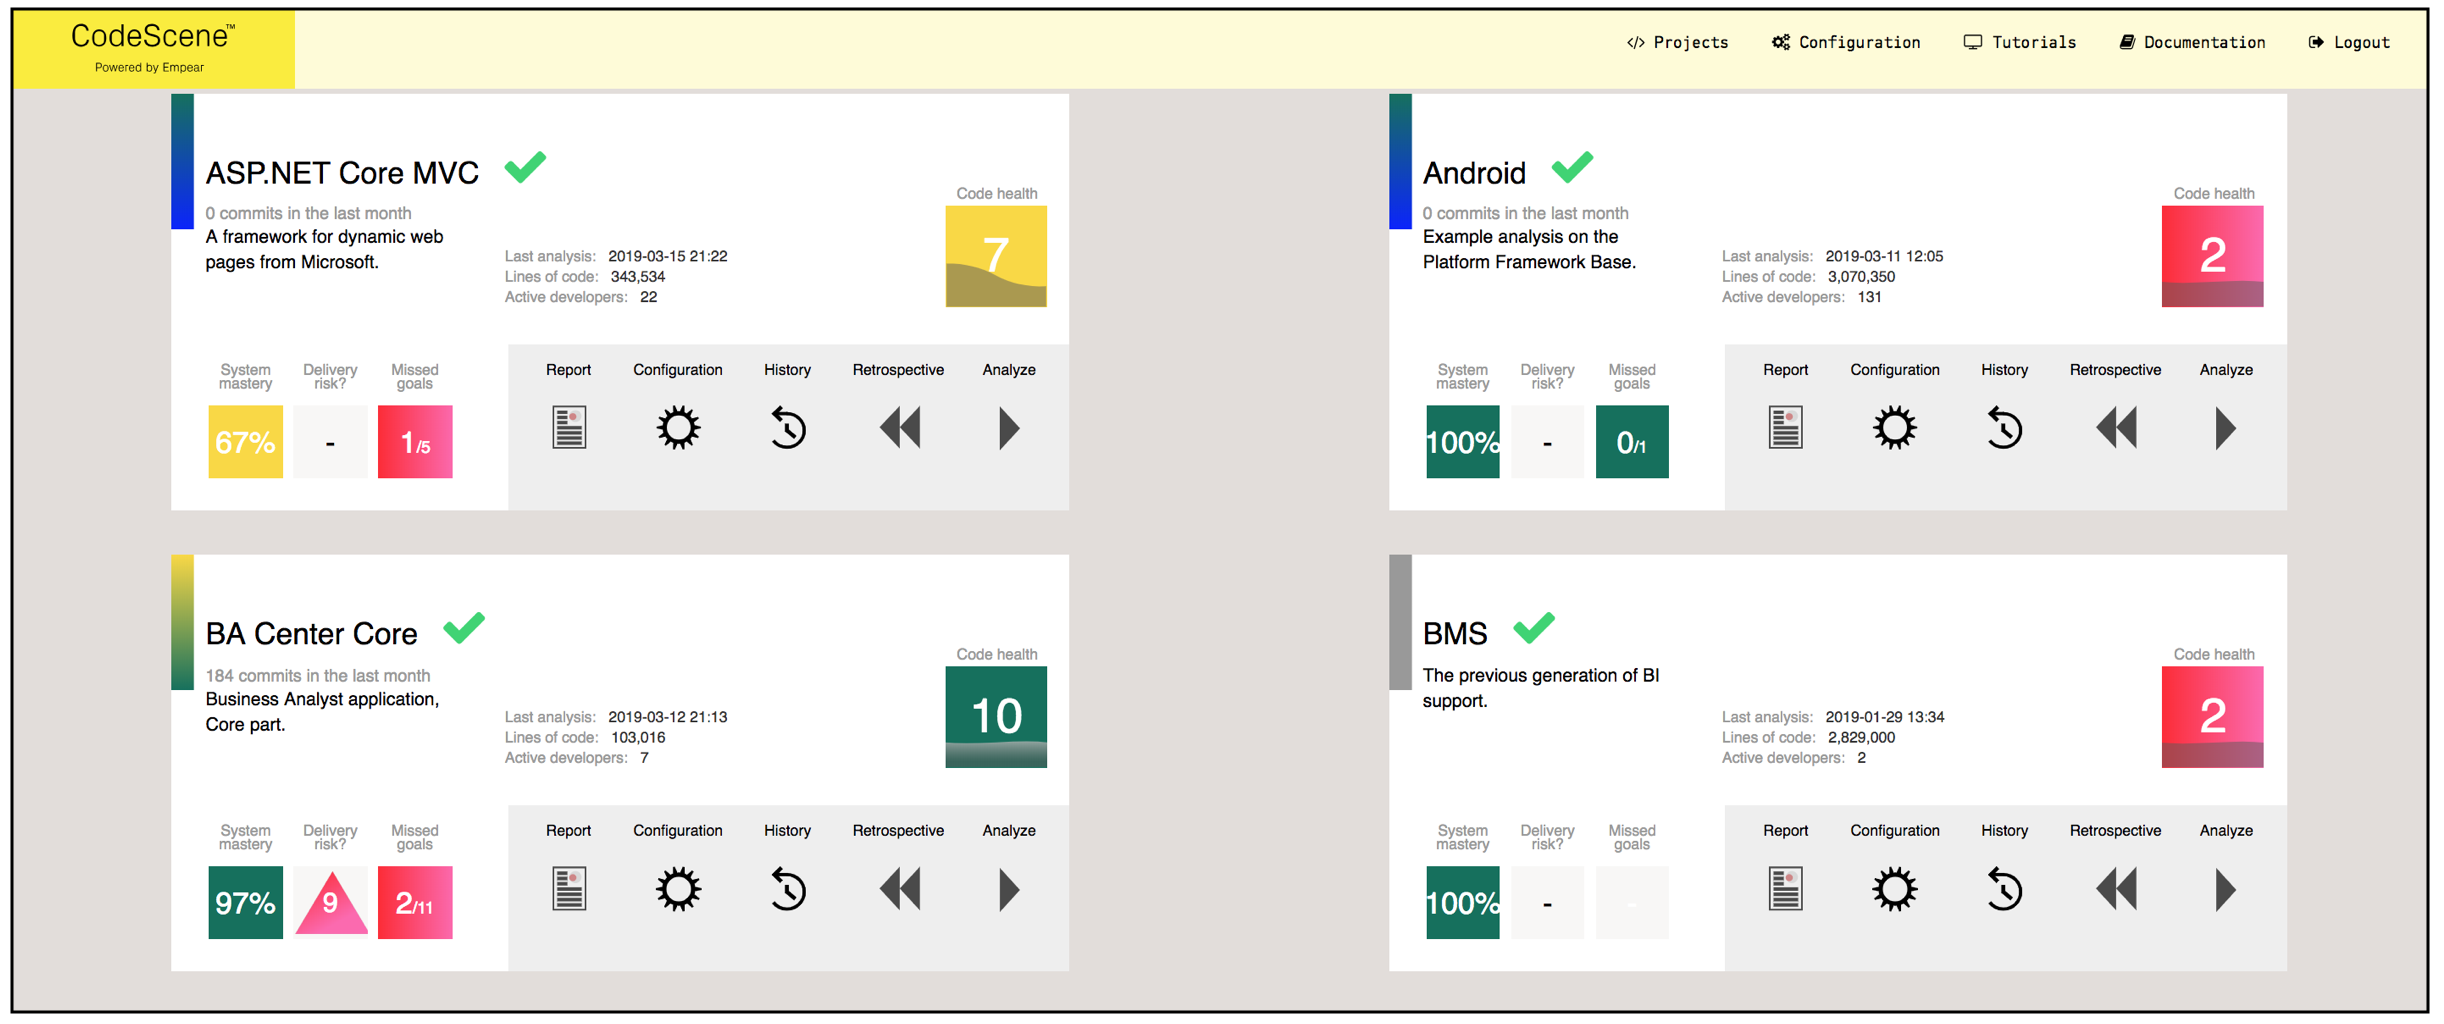
Fig. 26 The high-level dashboard shows that status of all your products at a glance.
Using these key metrics on the dashboard, in particular the progress on the goals, point you the products/codebase that you need to inspect in more depth.
You can also restrict access to certain analysis projects. Checkout CodeScene’s Dashboards: The Status of Your Codebase at a Glance for more details and use cases.
Subscribe to Auto-Generated Analysis Reports
CodeScene also offers auto-generated PDF reports adapted to different roles such as managers, architects, and lead developers. Using those reports, each stakeholder gets the most important information delivered without having to sign into CodeScene.
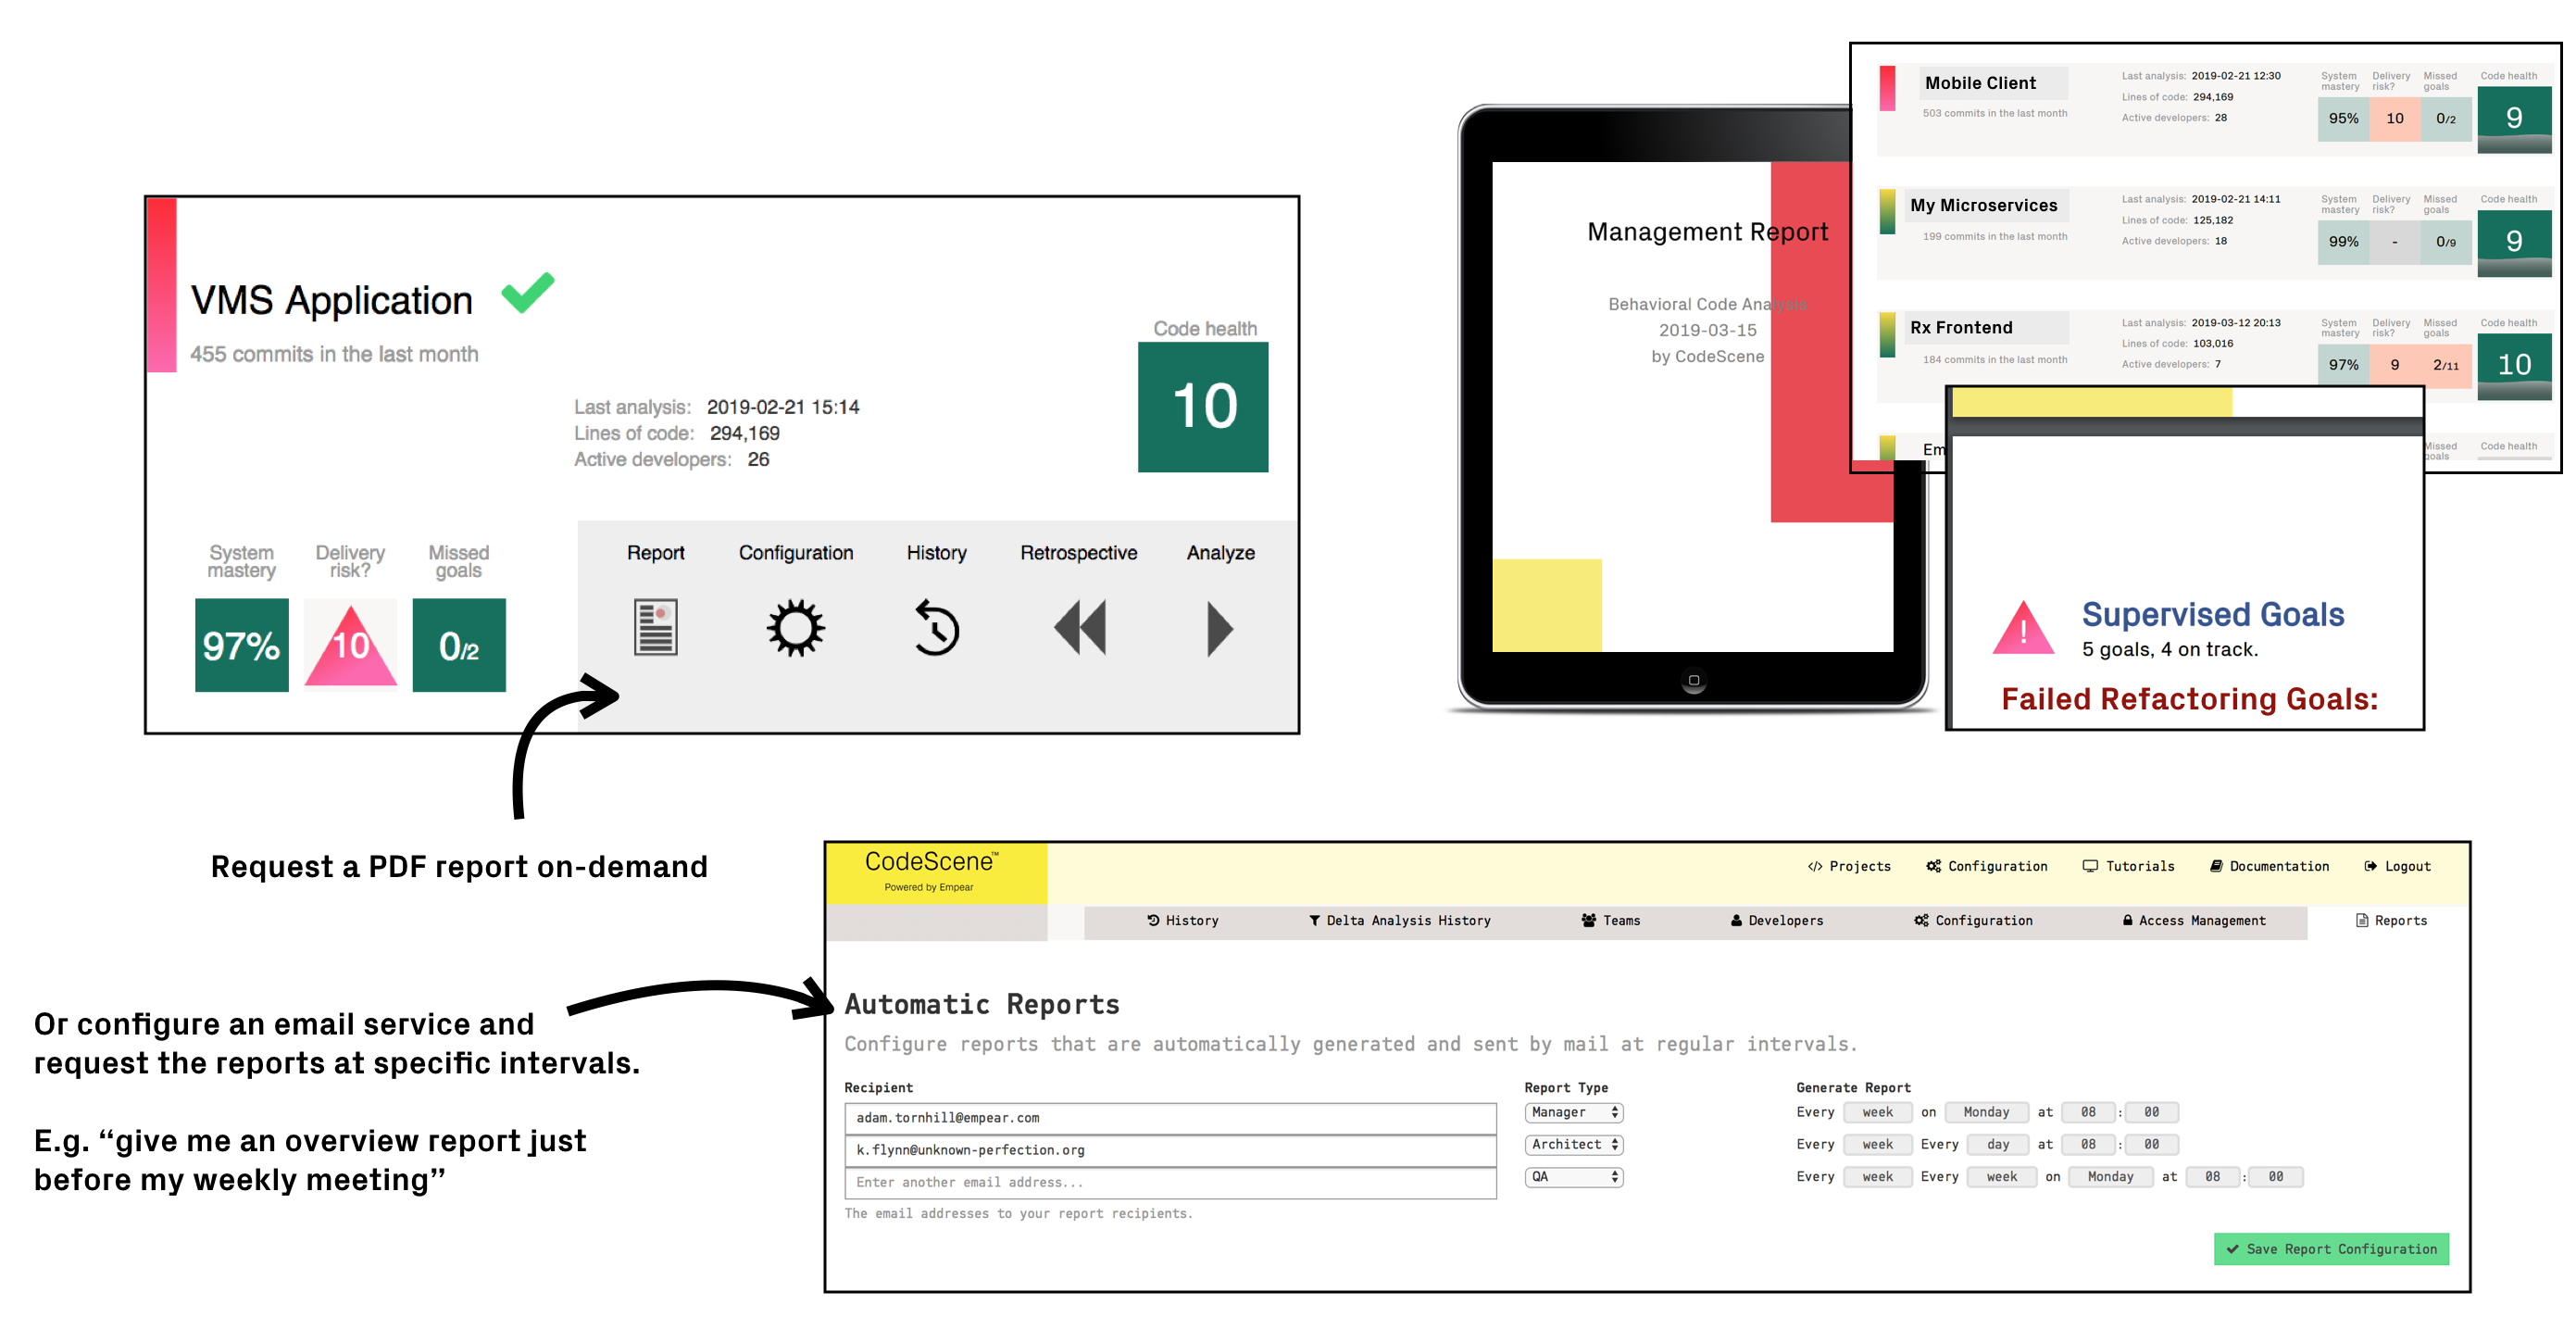
Fig. 27 Get an auto-generated analysis report emailed to you as a PDF or create it on-demand.
The reports too will highlight the progress of your planned goals and intelligent notes. You can create the on-demand from the inter-product dashboard, or configure CodeScene to automatically email them to you at specific intervals.
What’s Next?
This introduction has covered the main usage of CodeScene, which is to prioritize and act on technical debt. By following the recommended steps in this introduction, you will soon have your technical debt and the future of your codebase firmly under control.
To dive deeper, we recommend that you also check-out the following analyses:
- /guides/technical/temporal-coupling
- The Conway’s Law Analysis and the Architectural Analyses
- Team Planning with the On- and Off-Boarding Simulation