Measure Delivery Performance
Software development productivity is notoriously hard to measure. At the same time, it’s important to be able to visualize the business impact of any technical debt that CodeScene detects, and it’s also valuable to illustrate the effects of larger refactorings.
For that purpose, CodeScene includes a Delivery Performance module.
Delivery Performance Measures Lead Times and Defect Ratios
CodeScene’s Delivery Performance module focuses on throughput and lead time metrics that are known to correlate with business values like time to market, customer satisfaction, and profitability (see Accelerate: The Science of Lean Software and DevOps by Forsgren, Humble, and Kim for a deeper read on this topic).
Like most CodeScene metrics, the emphasize is on trends over absolute values. That is, it’s more important that you – as an organization – move in the desired direction than to compare your performance against any other entity in a different context. Let’s look at an example in Fig. 169.
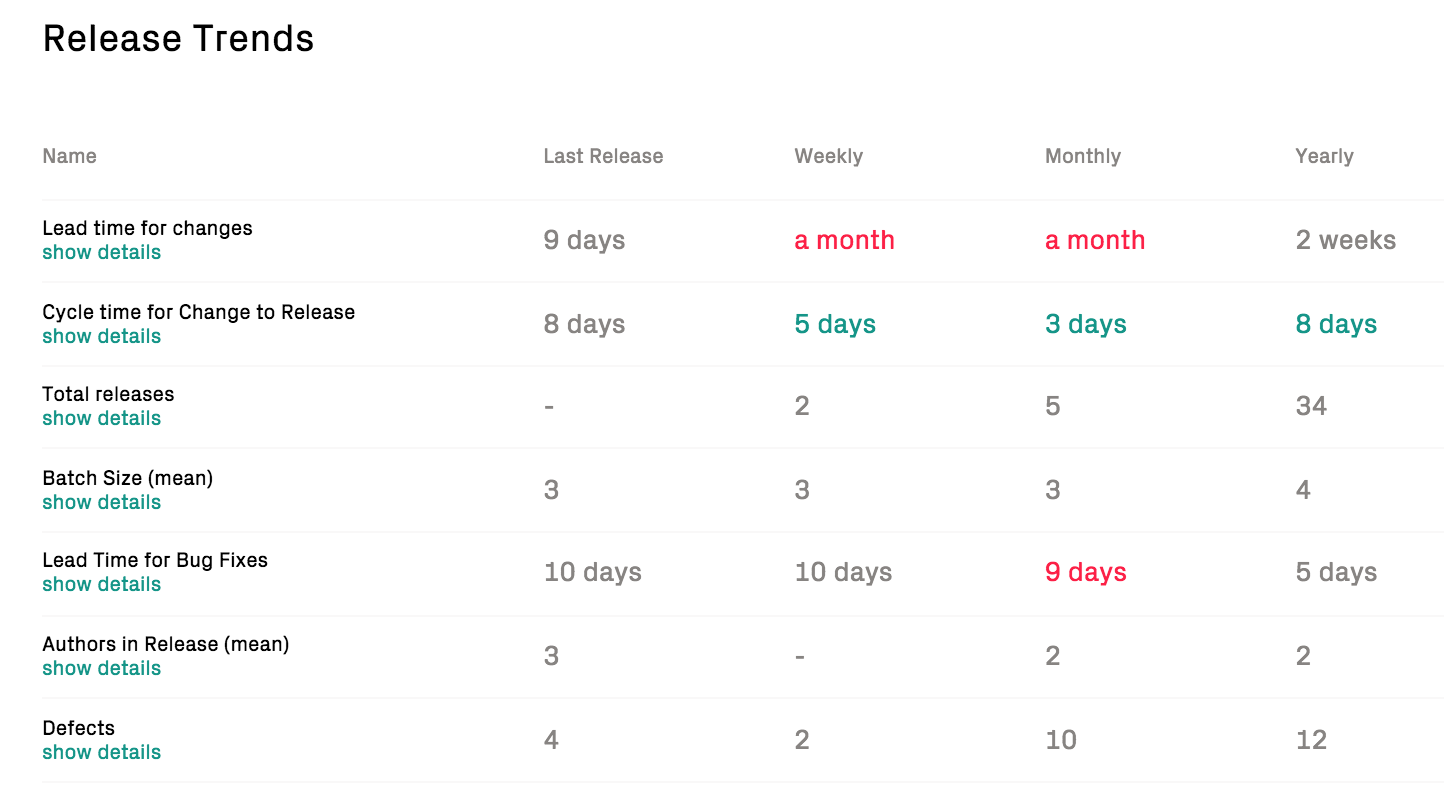
Fig. 169 CodeScene calculates trends based on the periodic releases.
The metrics are measured as follows:
- Lead Time for Changes: The lead time starts when a Jira issue enters an in progress/development state, and ends when the feature is included in a release. This is typically the most important metrics since lead times correlate with time to market.
- Defects: It would be trivial to shorten lead times if we compromised quality. Hence, we measure the number of defects fixed in each release. An increase might signal positive aspects like improved testing, or – more frequently – a degradation in external quality.
- Cycle Time from Change to Release: This cycle time starts when a commit is made until the commit is included in a release. A long cycle time from change to release indicates a bottleneck in the delivery process such as in-efficent code reviews, over-reliance on manual verification, or simply to in-frequent releases.
- Lead Time for Bug fixes: Measures the time from opening a bug/defect in Jira until the bug fix is included in a release. A long lead-time for bug fixes might mean that users have to wait for a response to issues, which might lead to less customer satisfaction.
- Batch Size: Measures the number of Jira issues included in a release. Efficient delivery is much about minimizing the amount of parallel work and releasing new features in small batches; the larger our releases, the more expensive it is to debug and isolate potential failures.
Measure the Costs of Planned vs Unplanned Work
CodeScene’s Jira integration (see /integrations/integrate-jira) provides a detailed breakdown of the development costs. To complement that data, the Delivery Performance module provides an overview of those development costs categorized as Planned and Unplanned work:
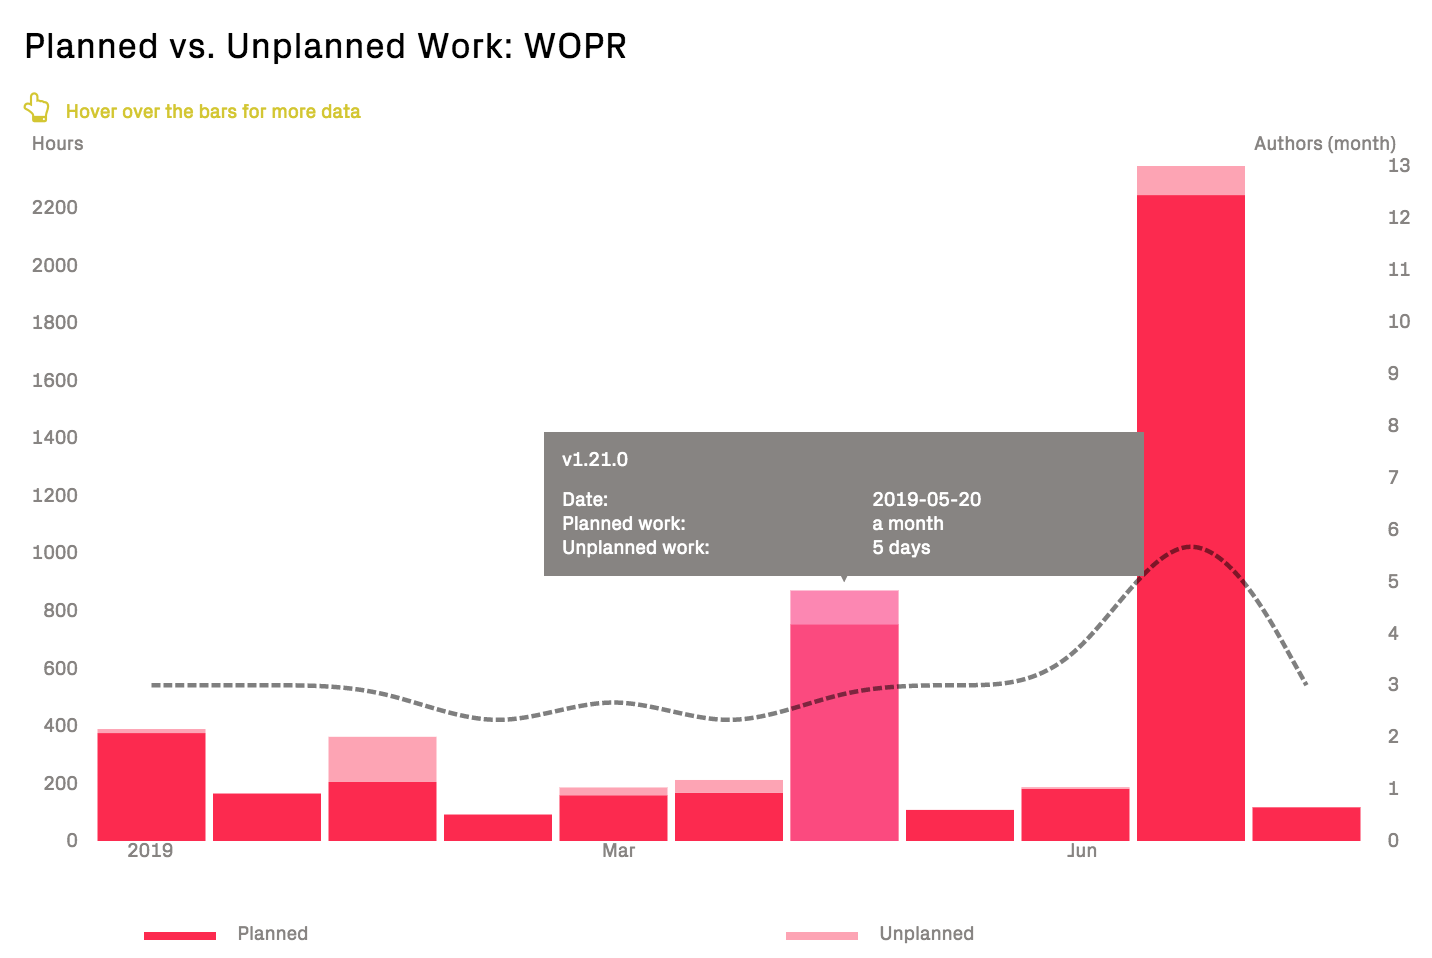
Fig. 170 Inspect how the development capacity is spent; do we spend our time mainly on Planned or Unplanned work?
The categorization is provided in the configuration. Typically, everything related to features or planned re-work is categorized as Planned, whereas bugs and service interruptions are Unplanned.
The amount of Unplanned work indicates the unrealized potential that can be optimized in an organization’s delivery efficiency; minimizing the amount of Unplanned work leads to more predictable progress and delivery pace.
The costs for Planned vs Unplanned work are measured using the configured cost model and unit, e.g. hours, issues, points, described in (see /integrations/integrate-jira).
Detailed Delivery Performance Graphs
All lead times and quality trends are complemented with interactive graphs that let you detect outliers and inspect specific releases.
The graphs are complemented with a trend showing the size of the development team over time. The rationale for including the scale of the team is that declining delivery performance trends often indicate on-boarding costs and/or increased communication and coordination needs (see Delivery Effectiveness by Organizational Trends for suggested follow-up analyses).
Interpret the Graphs
Here’s an example on a dramatic increase in lead times that indicate a delivery issue:
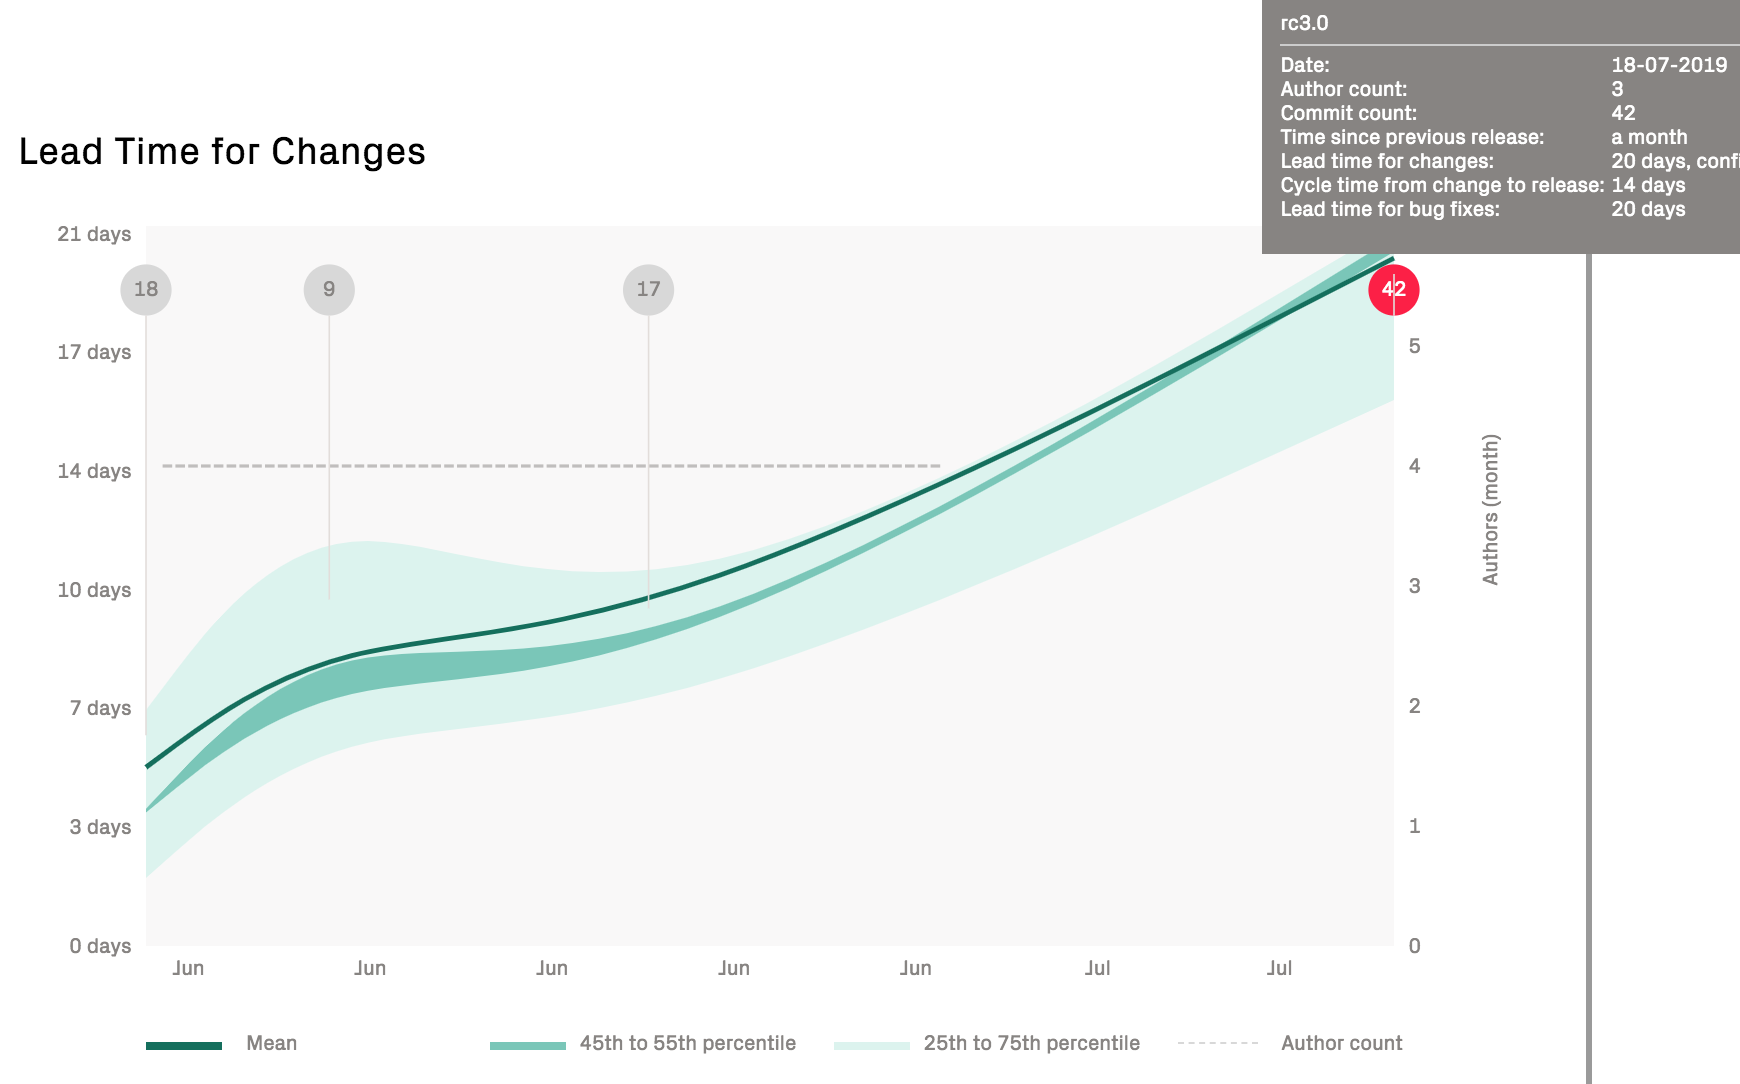
Fig. 171 Increasing lead times might indicate either organizational issues, planning problems, or growing technical debt.
The previous graph should be an immediate call to arms to uncover the potential bottlenecks in the product development. For that purpose, turn to CodeScene’s other metrics for organizations and technical debt. It’s also worth pointing out that the batch size has been increasing significantly in the preceding graph; the popups show that the last release is almost 3 times as large as the previous release.
We can get more information on the batch size trends in the next graph:
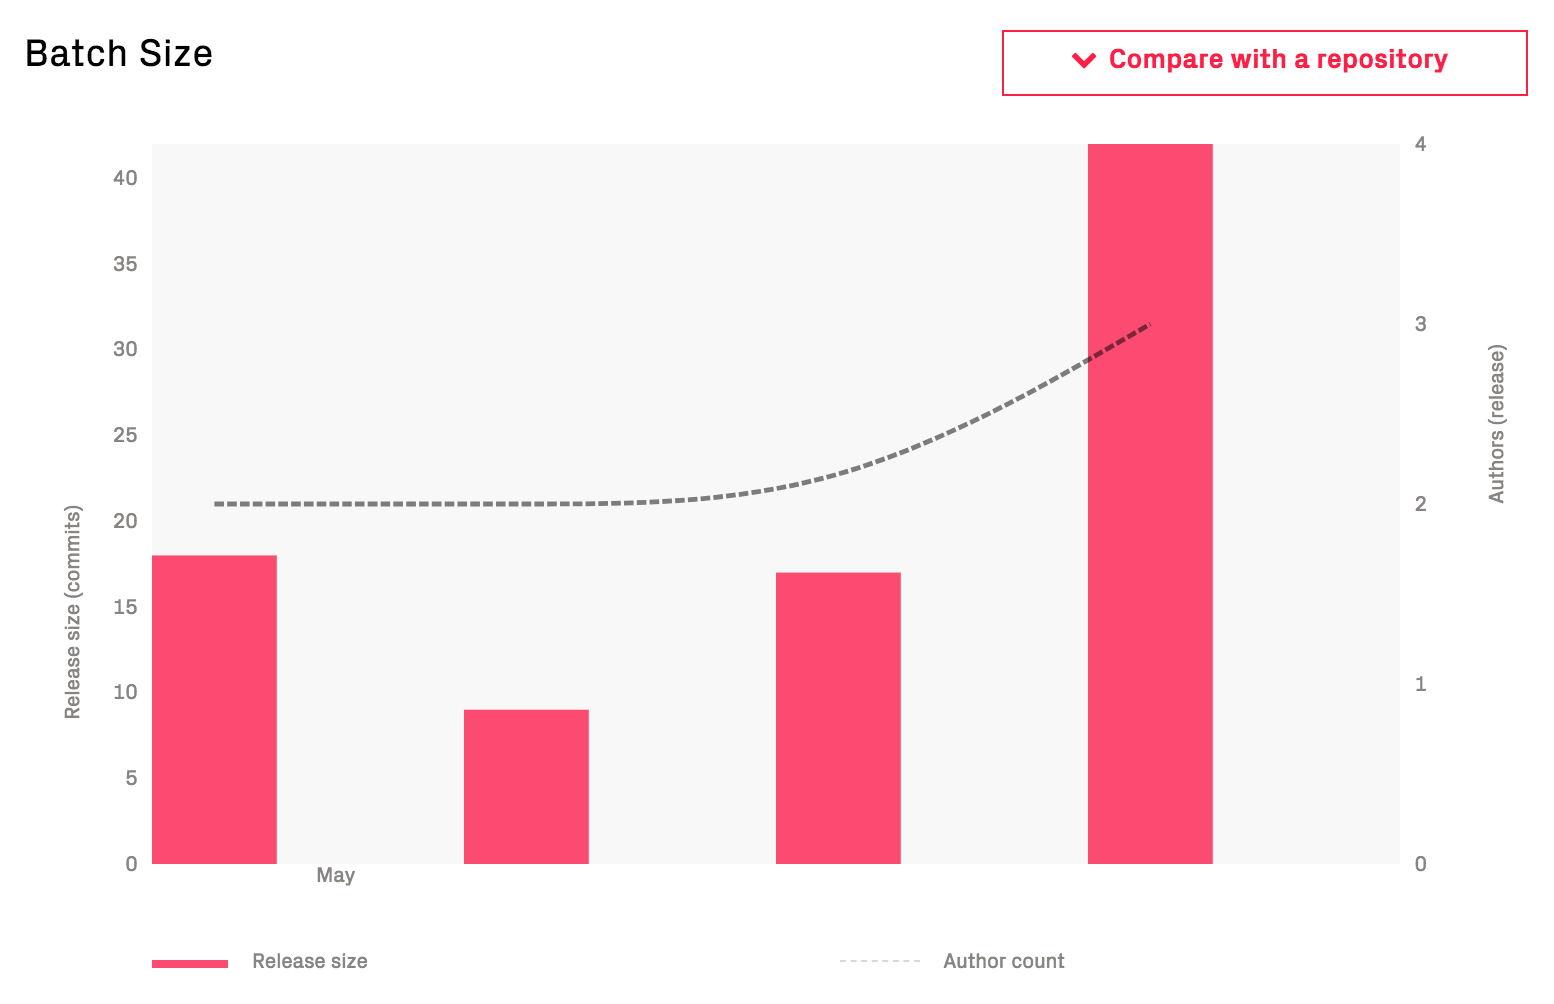
Fig. 172 Increasing batch sizes are an indication that too much work is included in each release.
Contrast the preceding trend with how the batch size looks in an organization that practices continuous delivery:
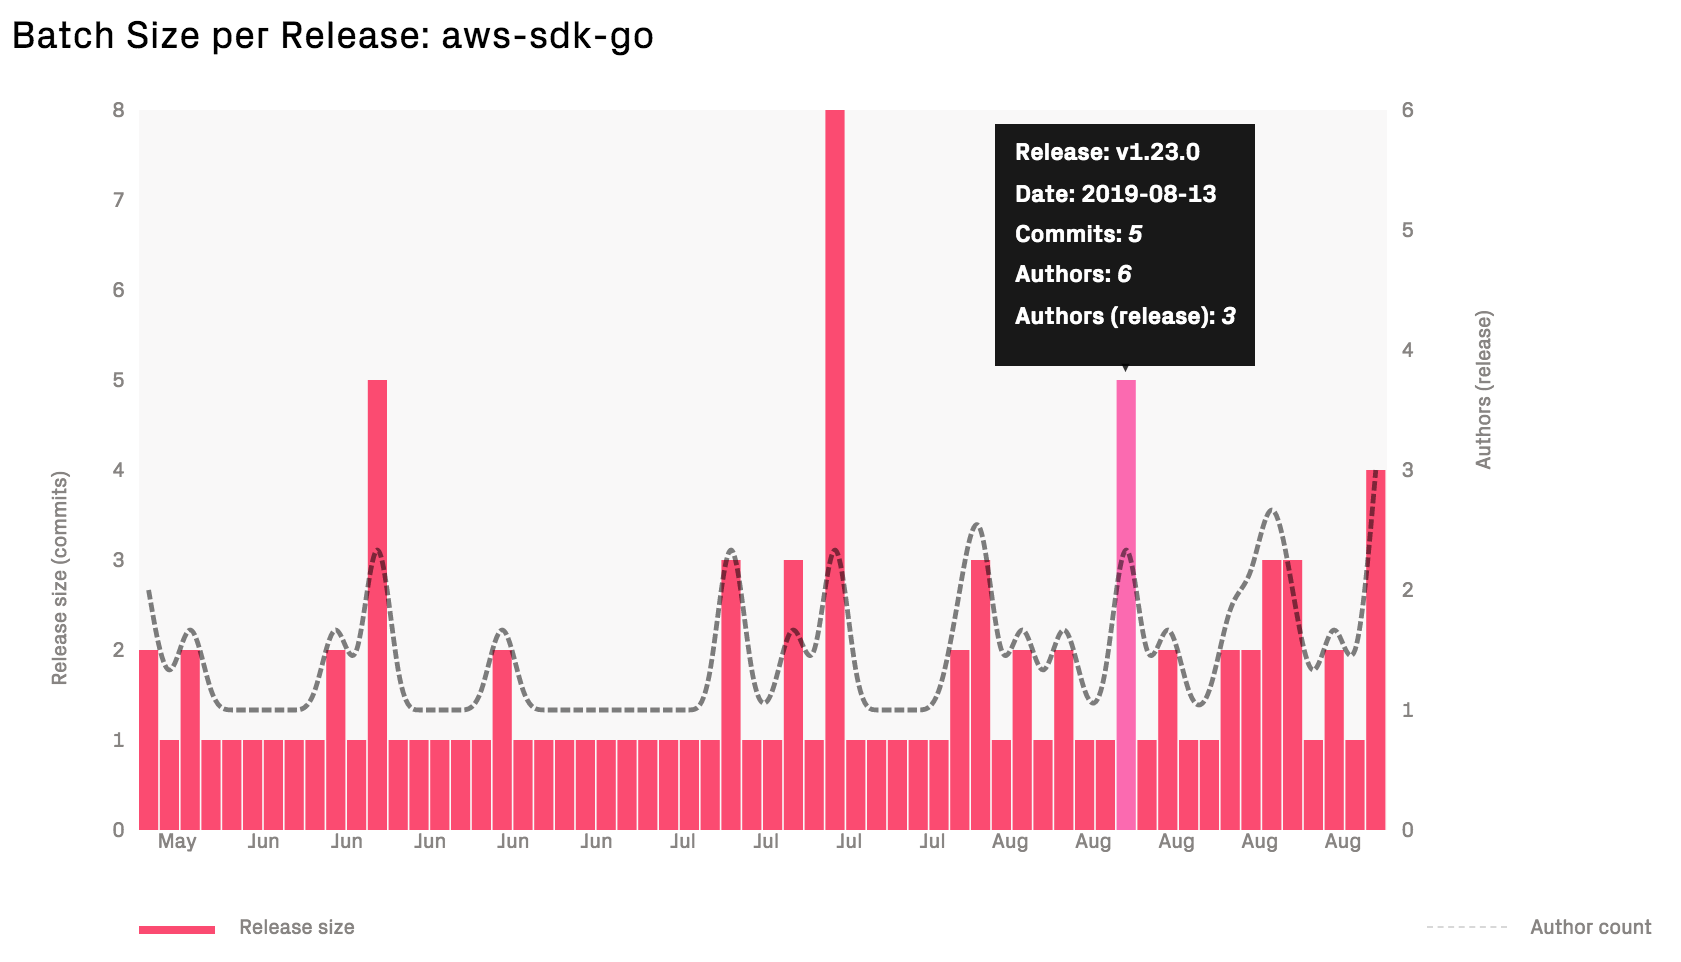
Fig. 173 In Continuous Delivery, each feature is released when it’s done.
Small batch sizes has a large impact on delivery performance; the smaller releases we do, the easier it is to track down and isolate any errors or failures.
Use the Predictive Analytics as Early Warnings
CodeScene’s delivery performance module also includes a set of predictive analytics that provide feedback on the work in progress. That is, CodeScene calculates metrics on the yet to be released commits and issues as shown in Fig. 174.
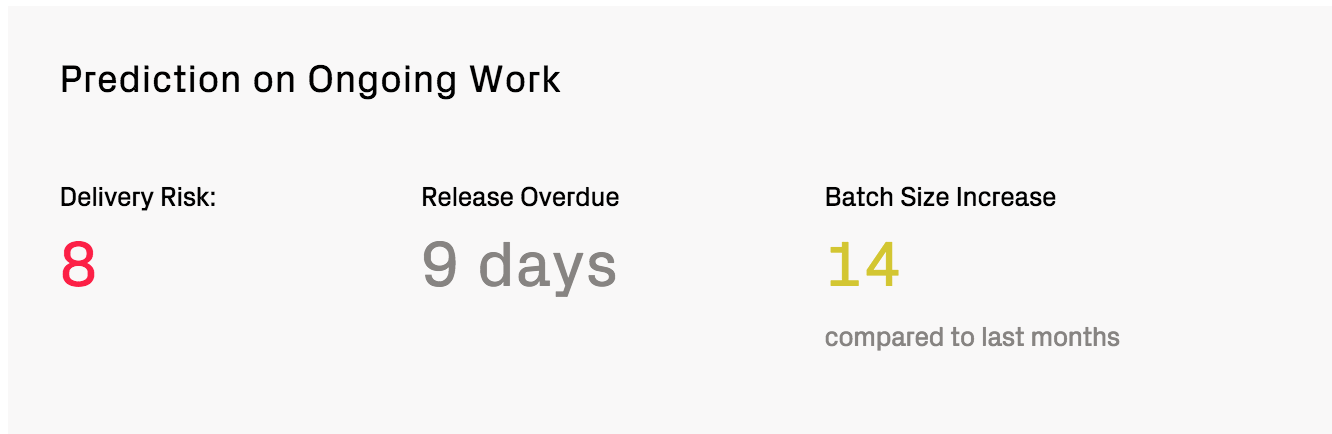
Fig. 174 Use the predictions on the upcoming release as early warnings.
These predictions are based on patterns in how you – as an organization – has worked so far; that’s how CodeScene knows that according to your typical ways of working, you should have released 9 days ago. Use such feedback as an indication that it might be time to cut the scope and wrap up the ongoing release.
The predictions on ongoing work serve as visual reminders on the importance of maintaining short lead times and to limit work in progress.
Pre-Requisites for the Delivery Performance Metrics
The metrics are based on the following data sources:
- Jira is used to fetch issues and information about the issue type, transitions, and creation dates.
- Commit data is used to calculate the scope, batch sizes, and cycle times.
- Git Tags are used to determine a release.
The Jira data is optional, but without it you cannot get the total lead time or time for bug fixes.
The Git Tags to identify a release are mandatory.
The Delivery Performance module is currently in beta status, which means it has to be enabled by a CodeScene administrator as shown in
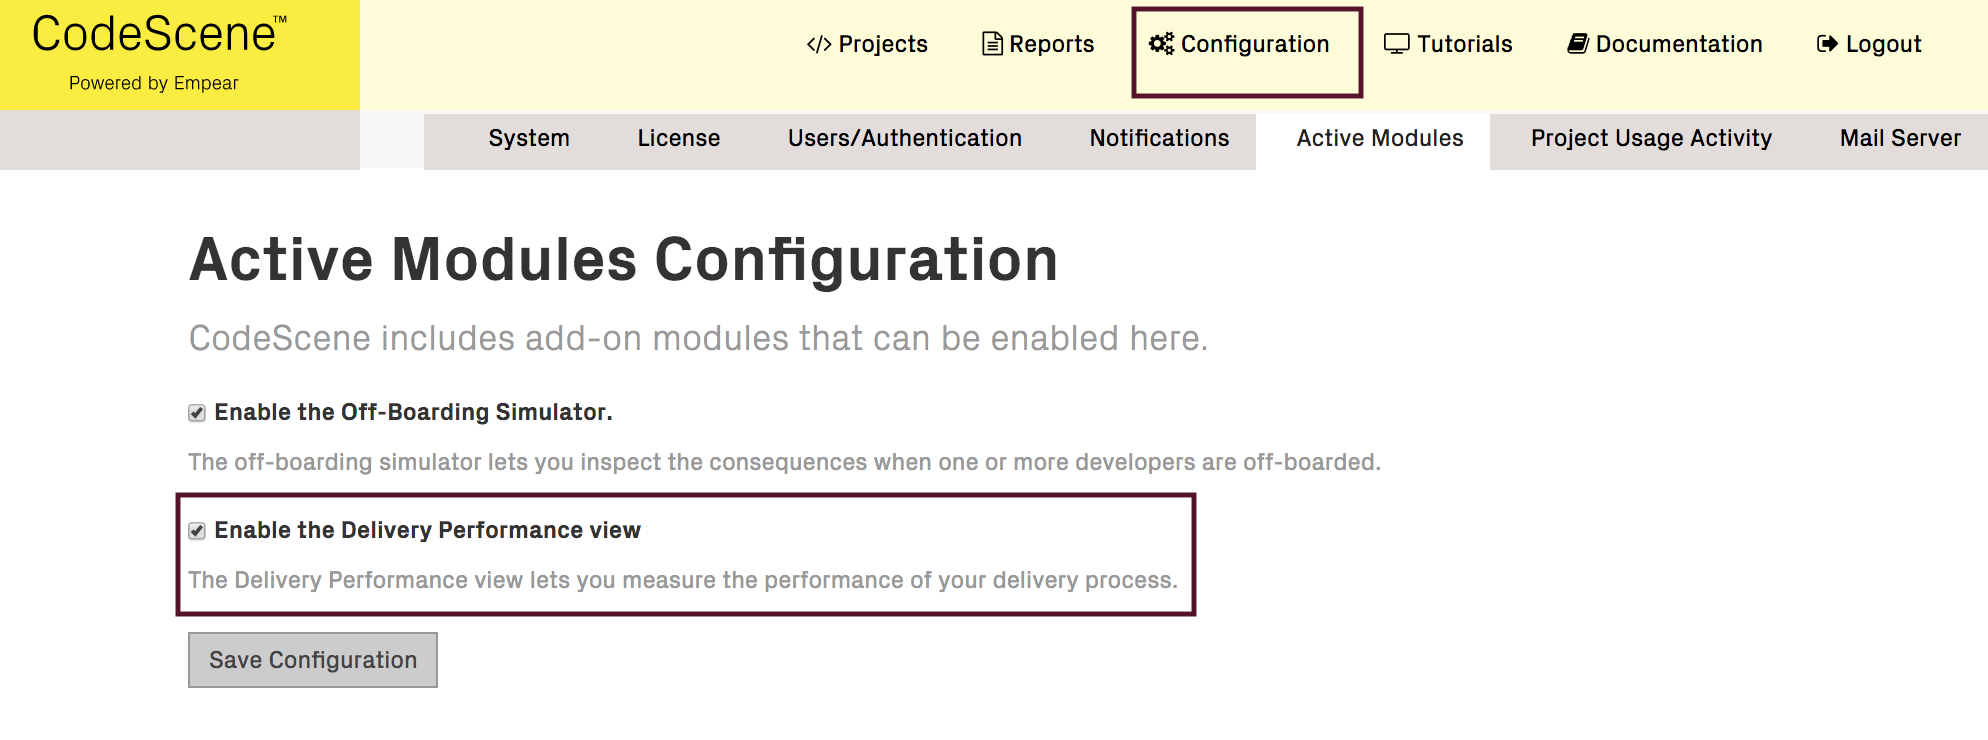
Fig. 175 Enable the Delivery Performance module in the global CodeScene configuration.