CodeScene’s Dashboards: The Status of Your Codebase at a Glance
CodeScene comes with several dashboards, each one serving a specific use case. In this guide we introduce the dashboard for an analysis, the inter-product dashboard, as well as the system health dashboard.
The Analysis Dashboard Presents the main KPIs
Each analysis project gets its own dashboard where you see the high level results of each analysis.
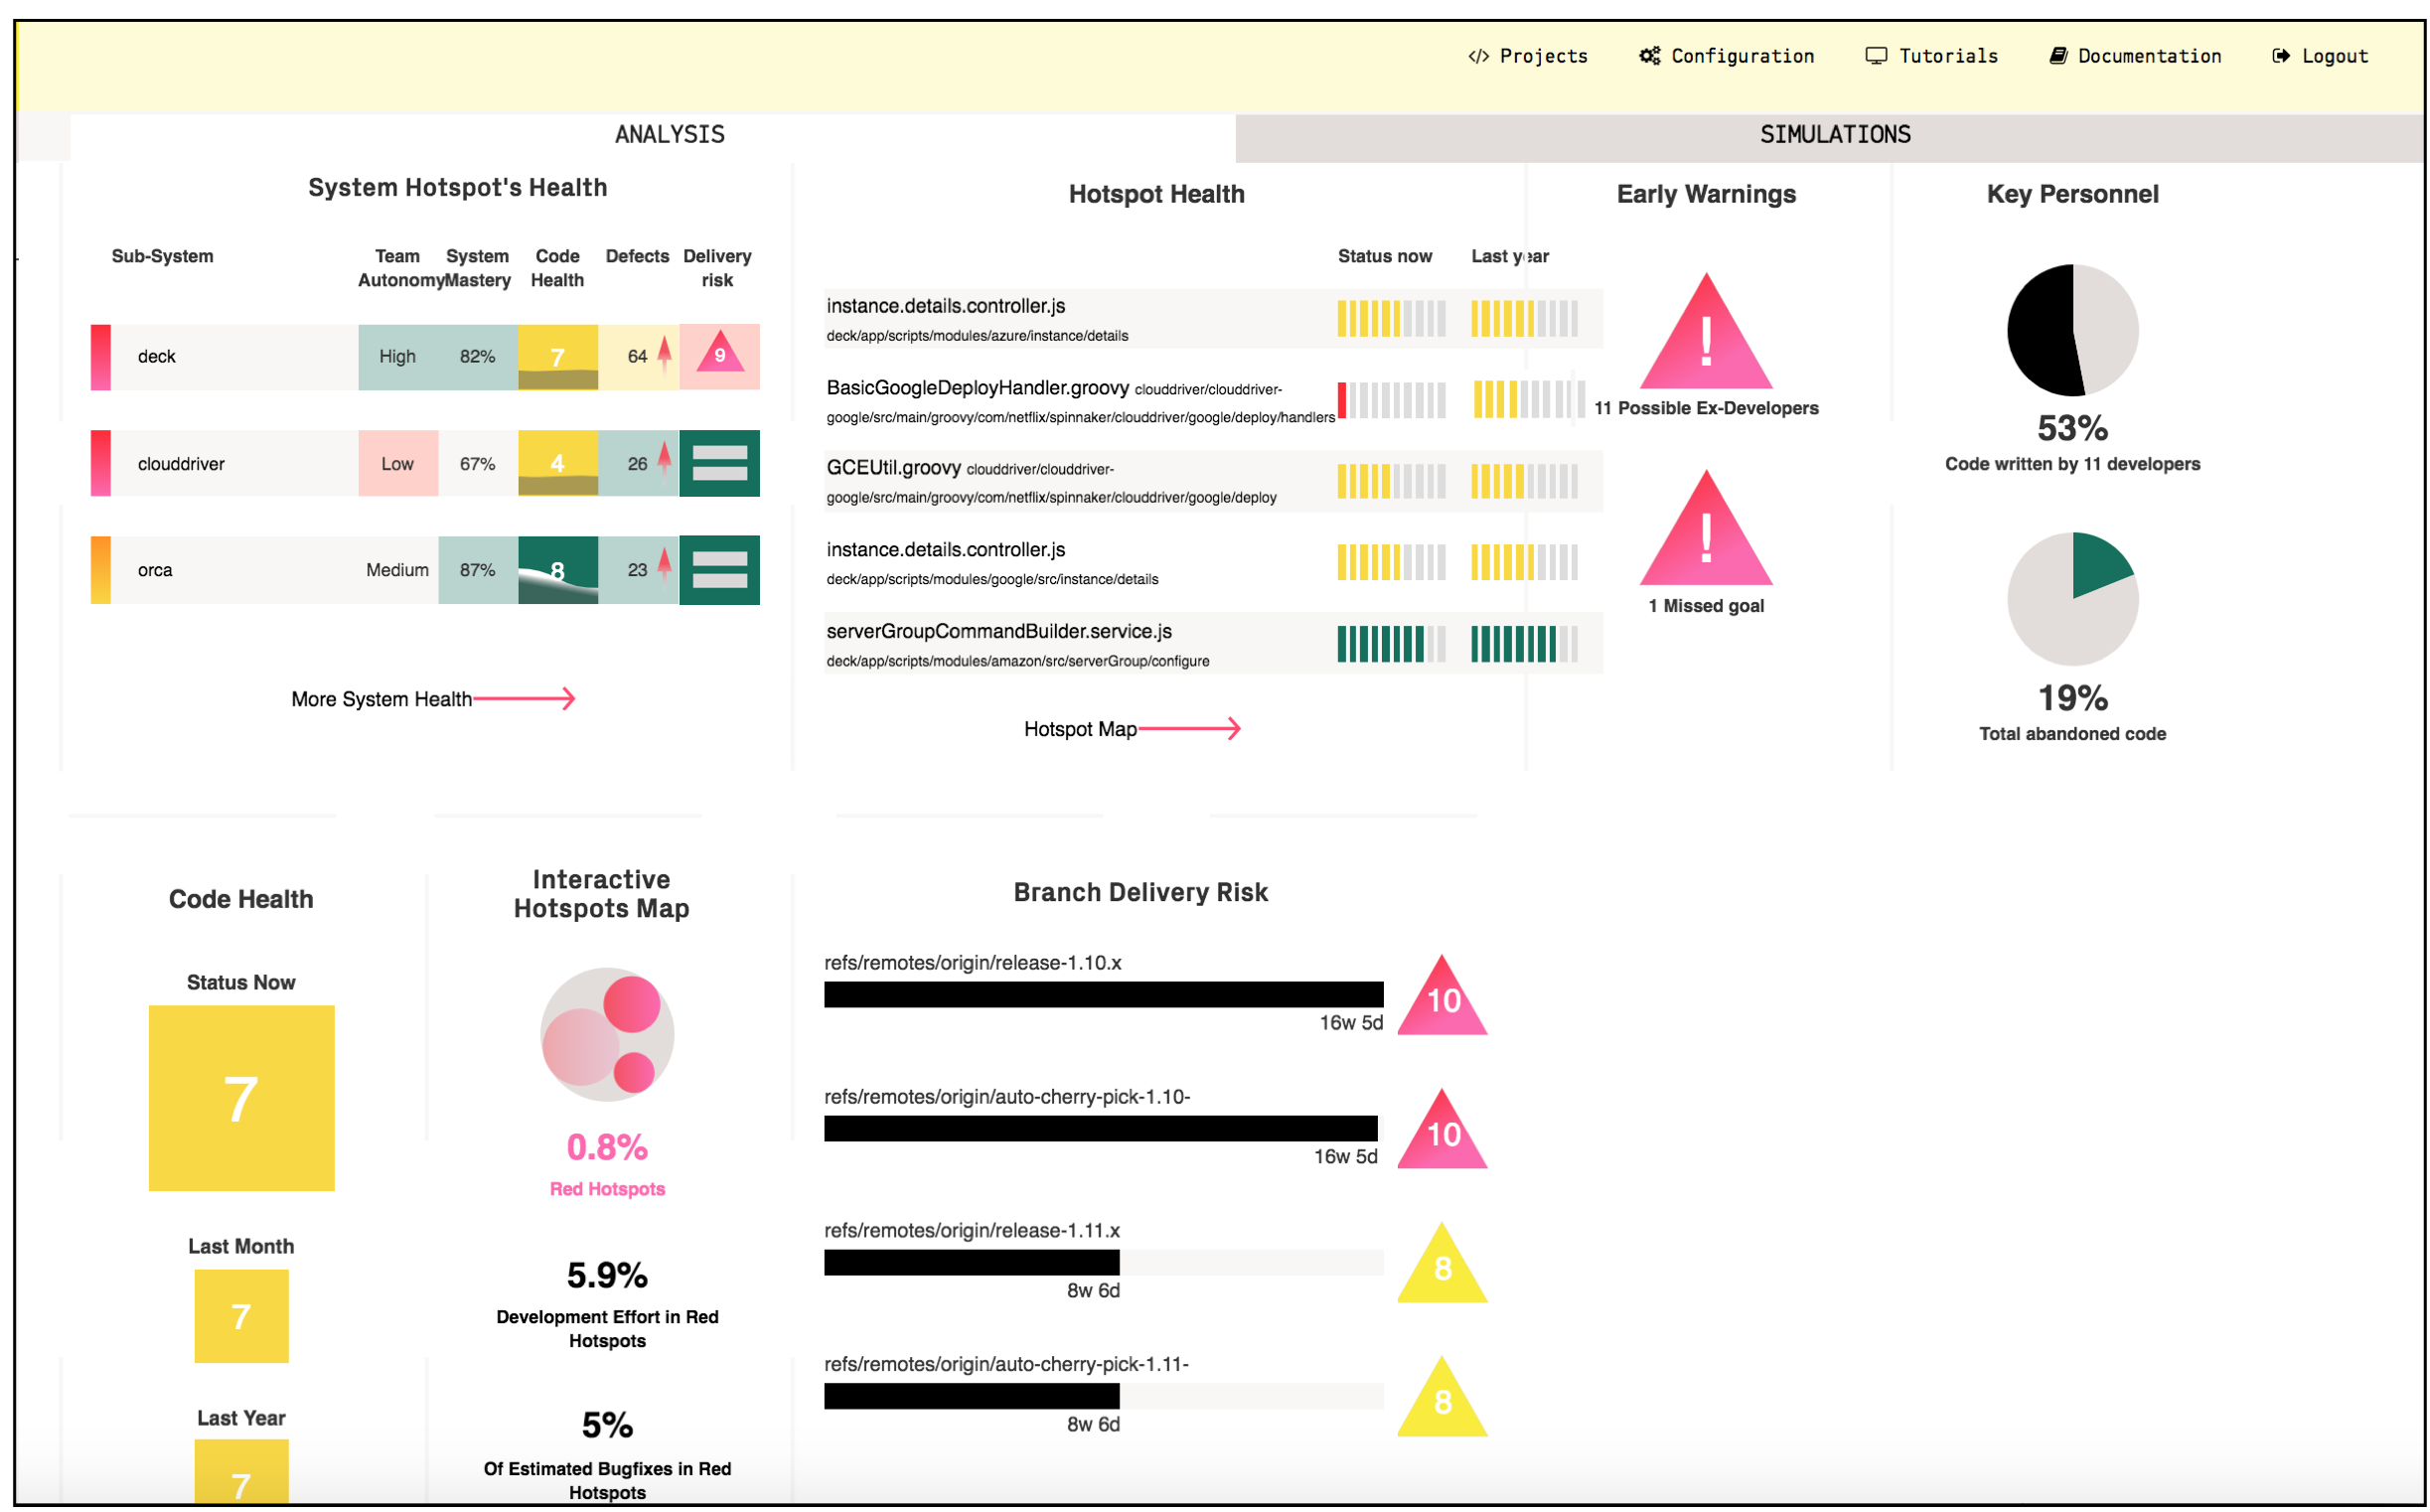
Fig. 40 CodeScene’s interactive analysis dashboard presents the key metrics at a glance.
The dashboard presents the following information:
- System Hotspot’s Health: Presents hotspots on an architectural level. The hotspots are sorted according to the
development activity in each component/sub-system/service. Each hotspot has the following information:
- Team Autonomy measures the degree of inter-team coordination in the code. The higher the team autonomy, the lower the risk for coordination issues and conflicting feature changes.
- System Mastery measures the percentage of the code that the current development team has written. A low number indicates knowledge loss.
- Code Health measures how easy and affordable it will be to understand, extend, and modify that part of the code. Code Health goes from 10 (code that’s relatively easy to understand) to 1 which indicates severe maintenance problems.
- Defects shows the number of bug fixes over the past month. The arrows indicate if the defects have increased or decreased compared to the previous month.
- Delivery Risk is a prediction of recent high-risk changes that have been made to the code of a particular architectural component. Use this to focus code reviews and testing activities. The risk prediction algorithm is described in more detail in Risk Analysis.
- Hotspot Health: This table list the top five hotspots in the codebase, together with the trend score for their Code Health. These hotspots are typically the ones where code improvements have the largest pay off.
- Early Warnings: CodeScene auto-detects potential problems and present them here in a prioritized order. Click on one of the warnings to get more details and act on the findings.
- Key Personnel: Detects a key personnel exposure where a significant part of your code is devloped by few people. Follow-up this finding by invesigating the knowledge distribution in CodeScene.
- Code Health simply shows that trend over the past month and year. A decline in Code Health is a sign that the switch has to be changed from adding new features towards improving the code in the top hotspots.
- Interactive Hotspots Map let you explore your whole codebase and identify technical debt as described in /guides/usage/index.
- Branch Delivery Risk shows you the predicted delivery risk and, when clicked on, detailed statistics of active branches. Use this to focus extra testing to where it’s likely to be needed the most.
Monitor a Specific Codebase via the System Health Dashboard
The System Health dashboad provides a real-time monitoring option. Use that one together with the full screen mode to display your system’s high-level status on a TV screen.
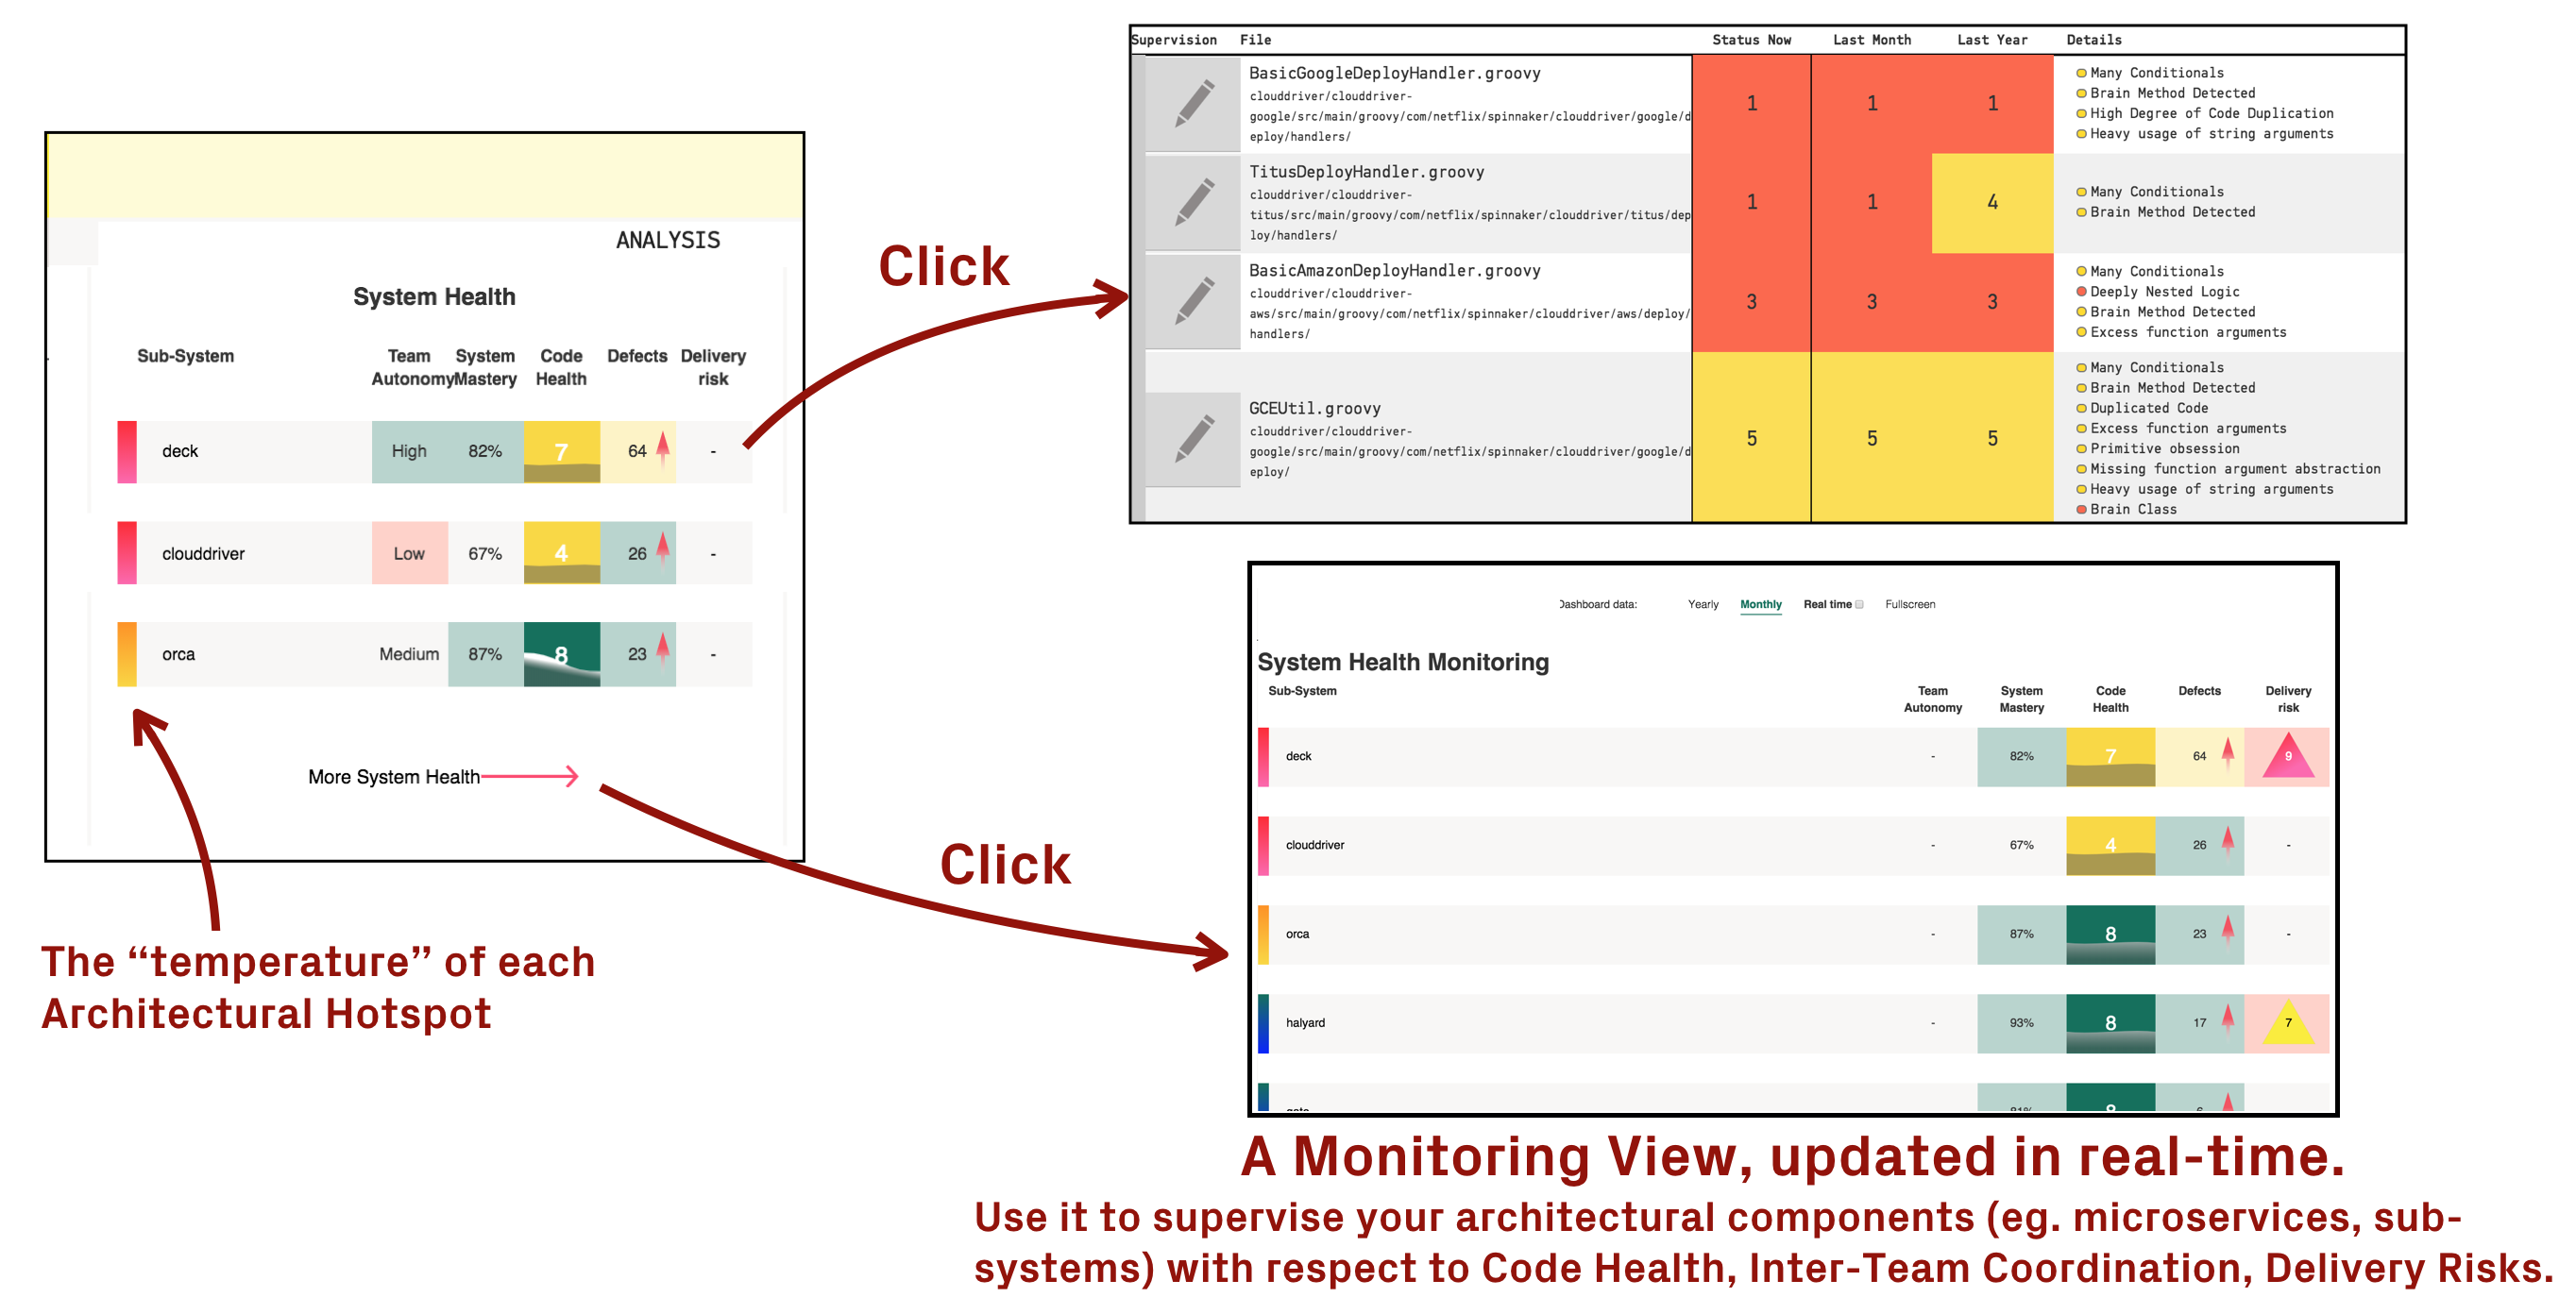
Fig. 41 The System Health dashboard lets you monitor the evolution of your sub-systems, services, or microservices.
The Inter-Project Dashboard gives an Overview of all your Codebases
CodeScene also presents an inter-project dashboard that gives you a high-level overview of all your products, as shown in Fig. 26.
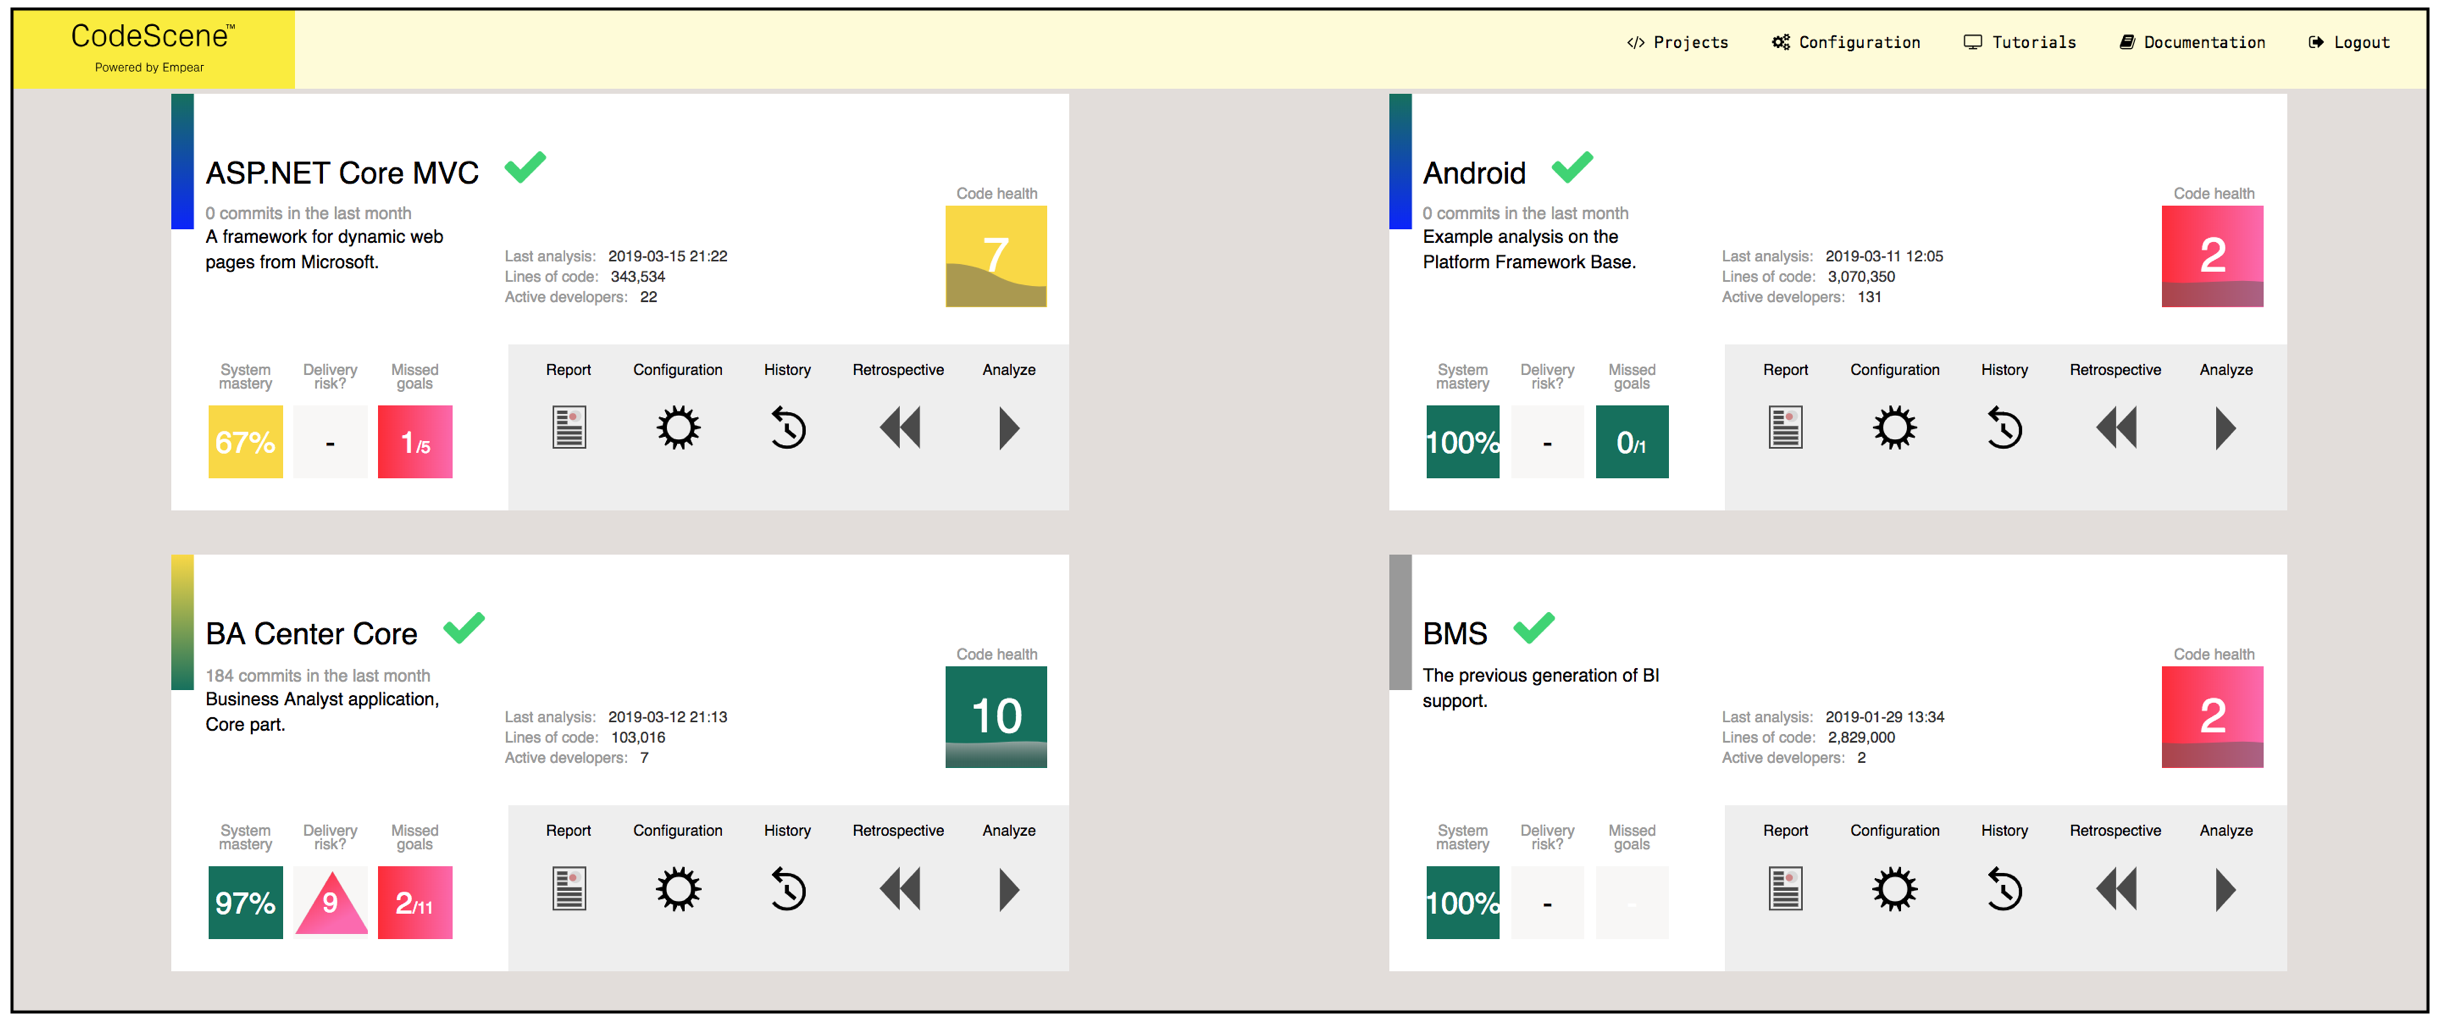
Fig. 42 The high-level dashboard shows that status of all your products at a glance.
Using these key metrics on the dashboard, in particular the progress on the goals, point you the products/codebase that you need to inspect in more depth.
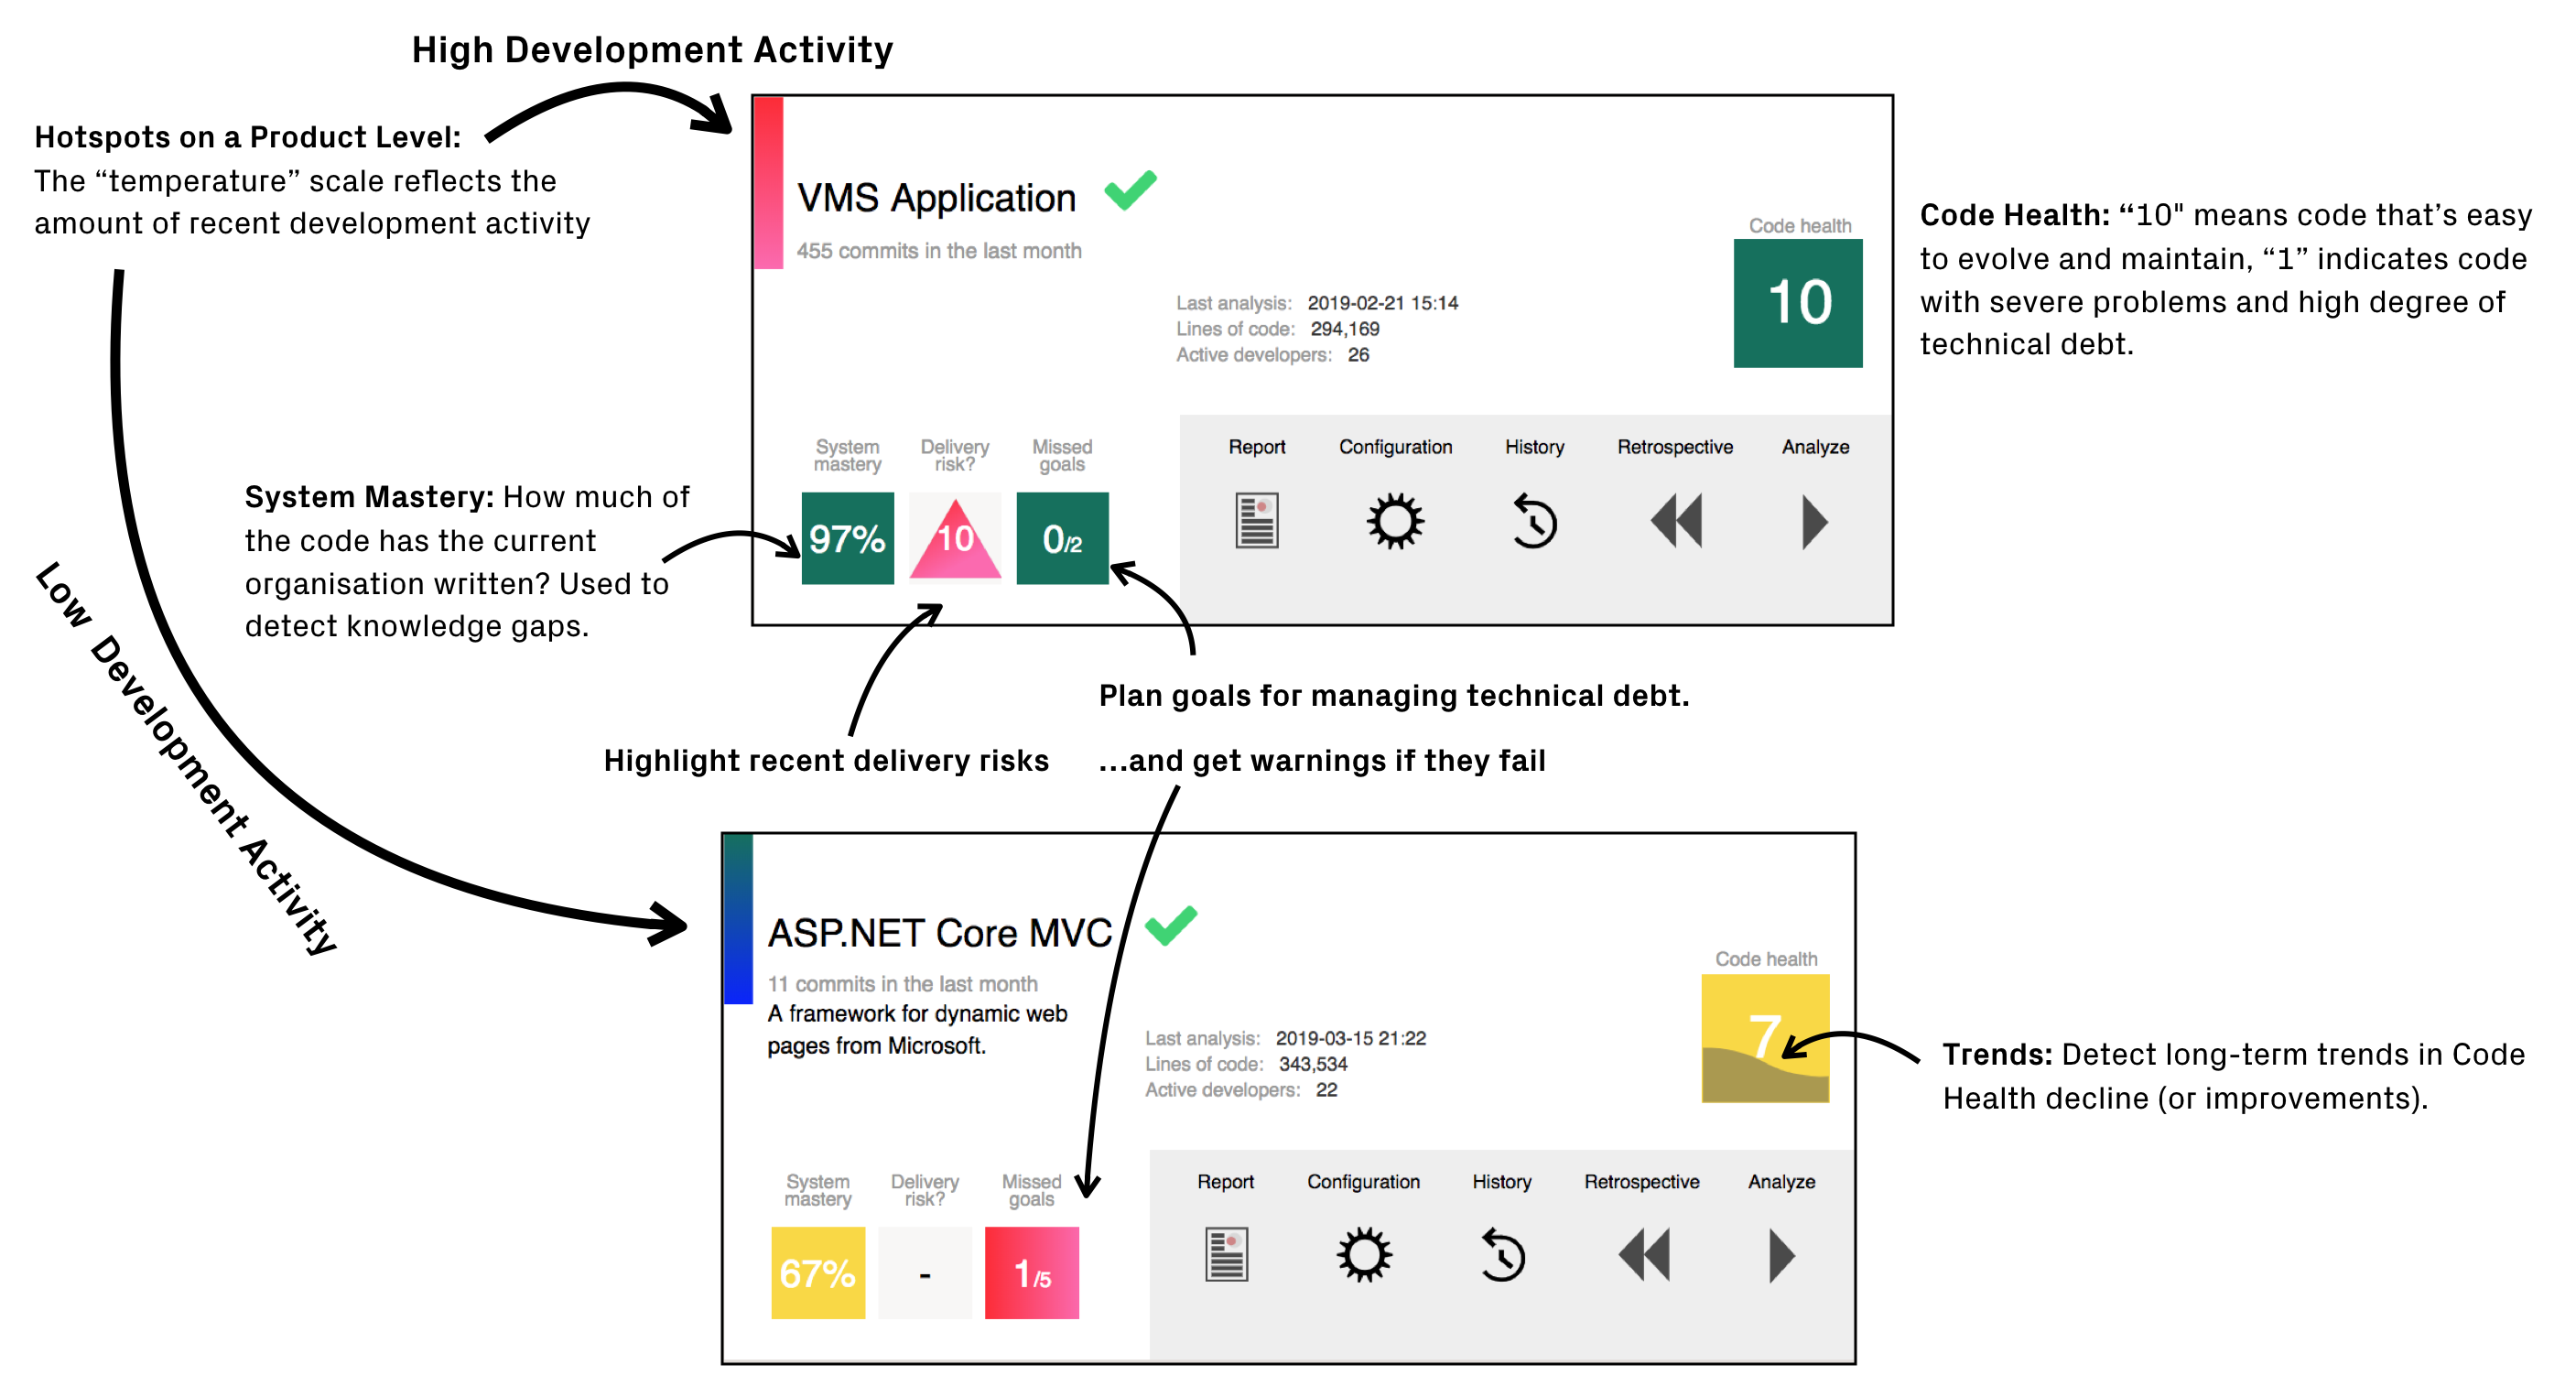
Fig. 43 The CodeScene inter-project dashboard explained.
Finally, note that you can restrict access to certain analysis projects as described in Users and Roles.