Development Output and Code Churn
CodeScene’s development output metrics indicates the rate at which your code evolves. Some common use cases include:
- Measure the effects of increases or decreases in staffing: There’s a certain point beyond which adding more developers to a project leads to lower output, not higher.
- Visualize your development process: Your code churn signature in the diagrams below mirrors the practices you use to deliver code. You may want to watch out for regular spikes, which may hint at a mini waterfall going on in your daily work
- Reason about delivery risks: Code churn is a good predictor of post-release defects. Thus, it’s a warning sign if you approach a deadline while your code churn increases. That’s a sign that the code gets more and more volatile the closer you get to your deadline. You want the opposite. You want to stabilize more and more code the closer you get to delivery.
- Track trends by task: CodeScene lets you inspect the size and impact of your tasks. Use the information to see if your project management tasks are on an appropriate level or if each one of them implies a mini big bang in terms of code changes.
CodeScene provides several churn measures. They’re all described in this guide and you typically investigate all of them to get the overall trend in your codebase.
Broks’s Law and Development Output Trends
Brooks’s Law states that adding more people to a late software project makes it later. The reason for this is communication and coordination overhead. While we get more total hours available with more people, those available hours increase lineary but the coordination paths increase exponentially. Hence, there’s a point beyond which each additional person’s hours get comsumed by the increased coordination efforts…and then some.
Hence, use CodeScene’s development output to measure the effects of any chaning in staff as shown in Fig. 86.
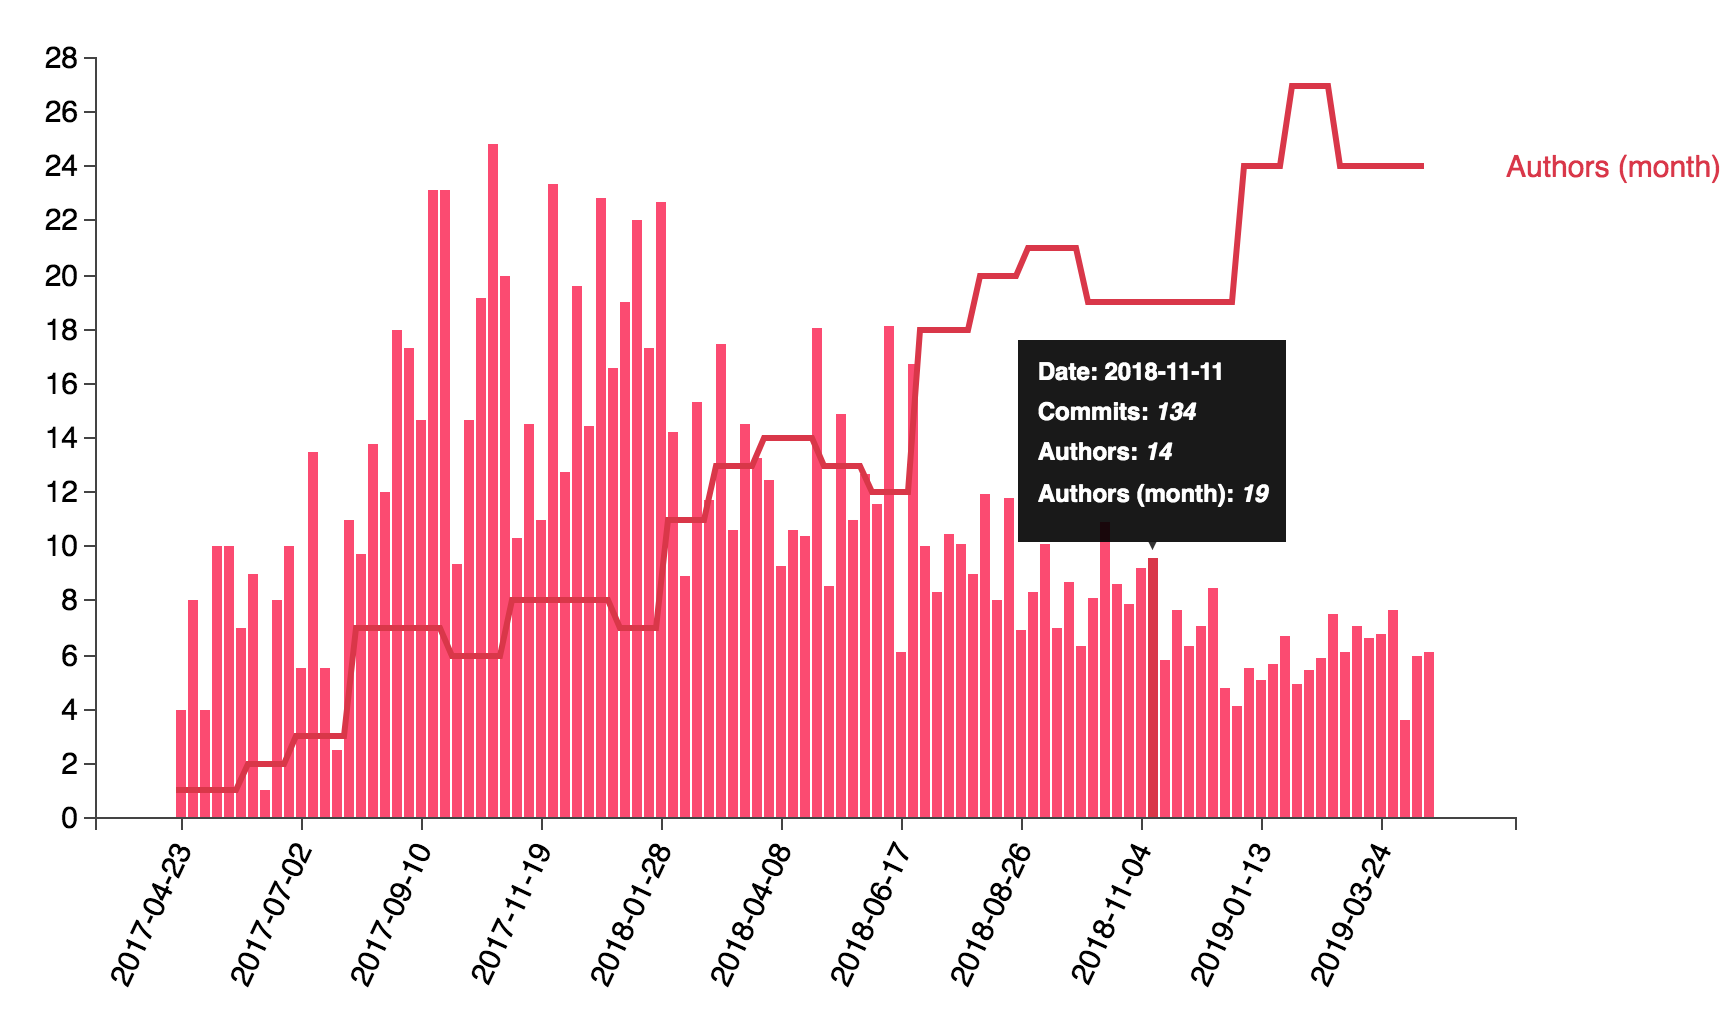
Fig. 86 Trends in development output with respect to the number of contributing authors.
The development output graph shows the following date:
- Development Output: This is measured by taking all commits during a week and divide them by the number of contributing authors. The resulting normalized output metric gives you an estimate on the organizations’s output.
- Authors (month): This trend shows how many unique authors that have contributed code over a month. This trend is likely to reflect the total number of developers on the project.
If your project is at risk to fall victim to Brooks’s Law, then you will see this as an increased distance between the total number of authors and their normalized output.
Like always when trying to measure things like developer and organizational productivity, the absolute numbers aren’t that interesting; the interesting thing is the trend. Do you get an increase or decrease in response to a chaning in staffing?
Use the Commit Activity as the Pulse of your Codebase
The commit activity chart shows the number of commits and contributing authors over time as illustrated in Fig. 87.
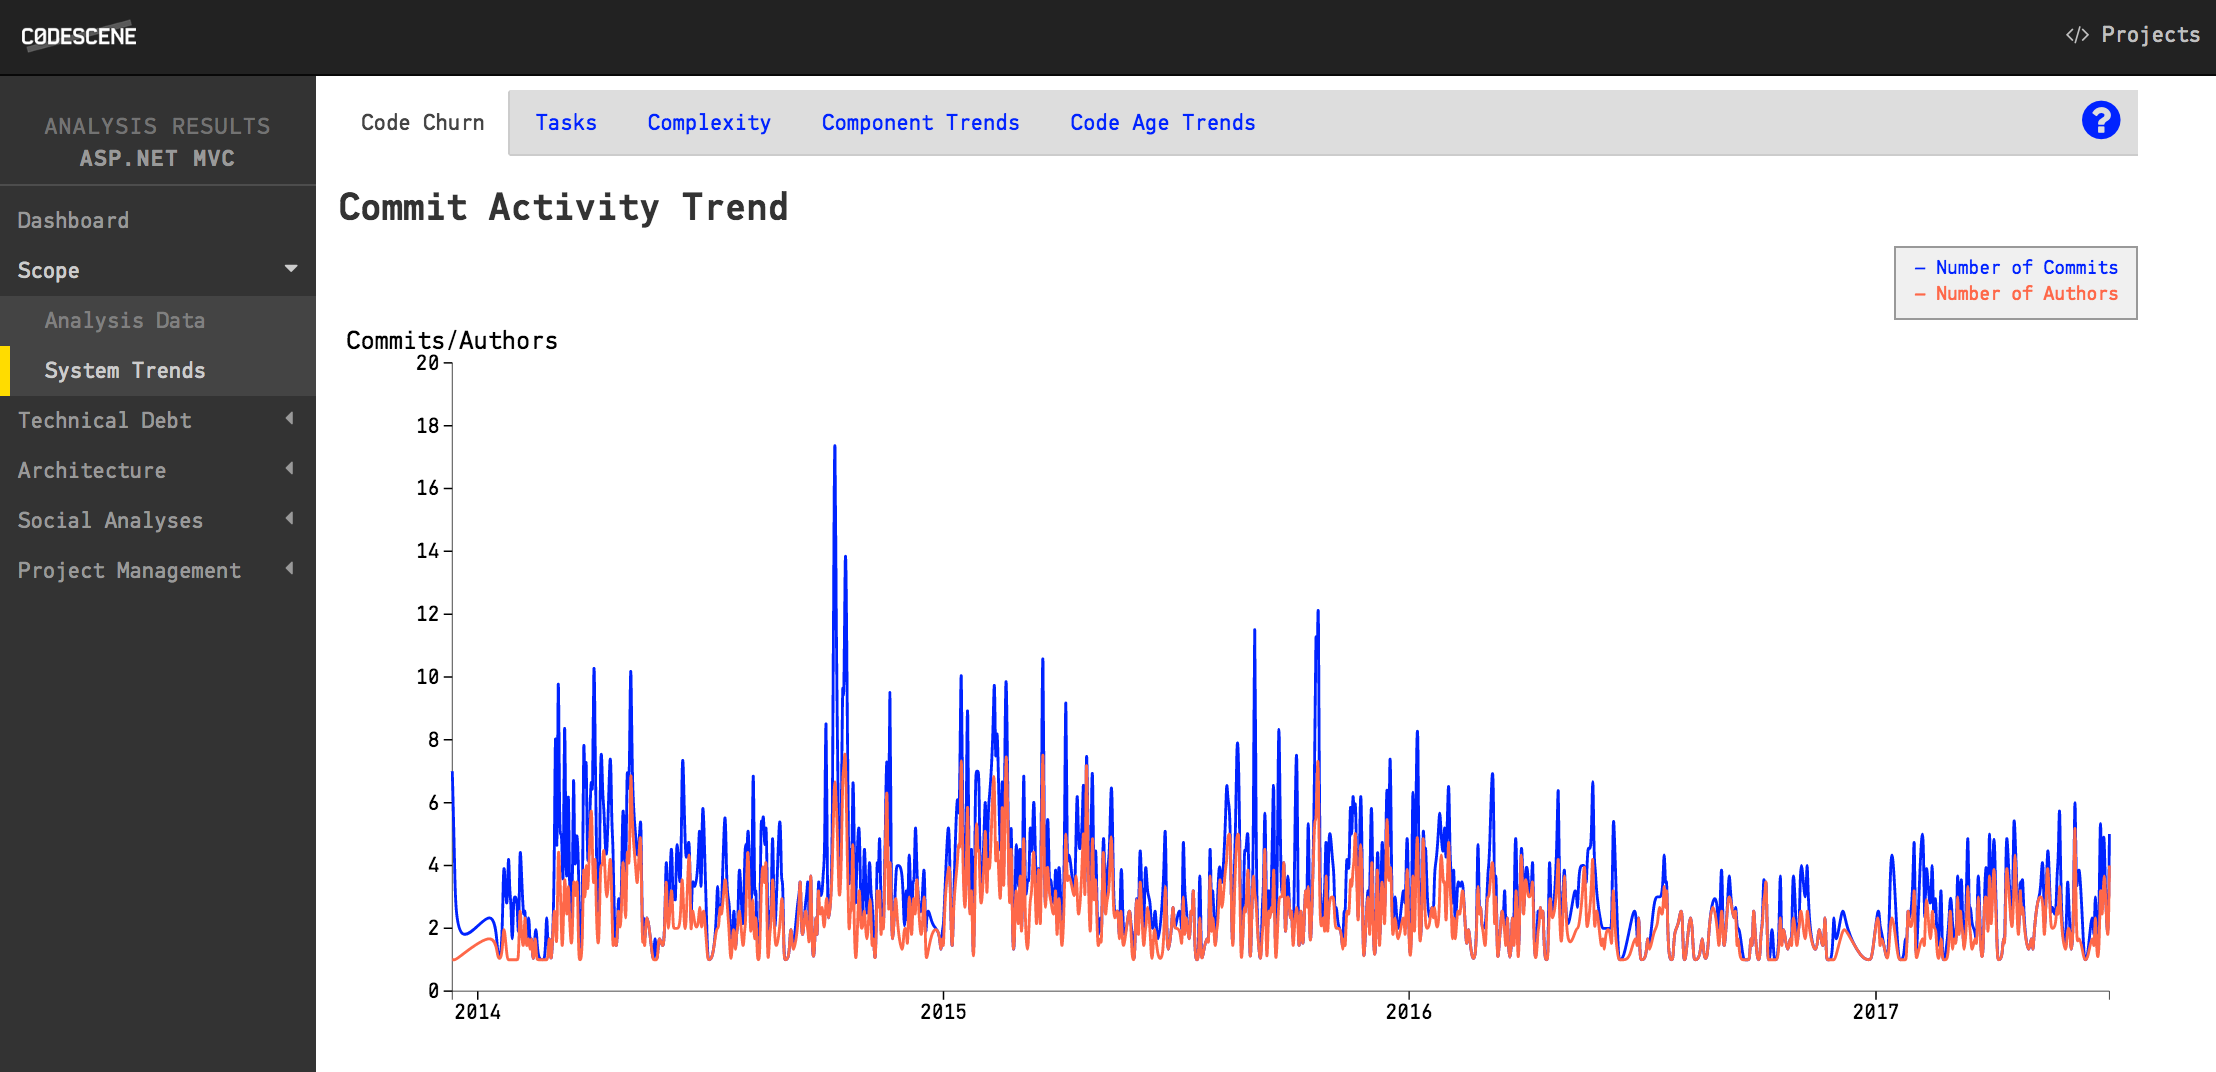
Fig. 87 The commit activity chart.
The number of commits and authors over time is a different kind of churn. This metric will typically correlate well with your other Code Churn metrics described below. However, you want to look out for potential productivity issues like an increase in authors without a corresponding increase in commits and churn; Such a trend often indicates that you’ve more programmers contributing than the software architecture (and/or organization) can support.
Correlate Trends in the Number of Contributors with the Churn Metrics
The Active Contributors trend shows the number of authors in the codebase over time. CodeScene calculates this information by looking at the first and last recorded contribution times for each author. This lets you view a trend as illustrated in Fig. 88.
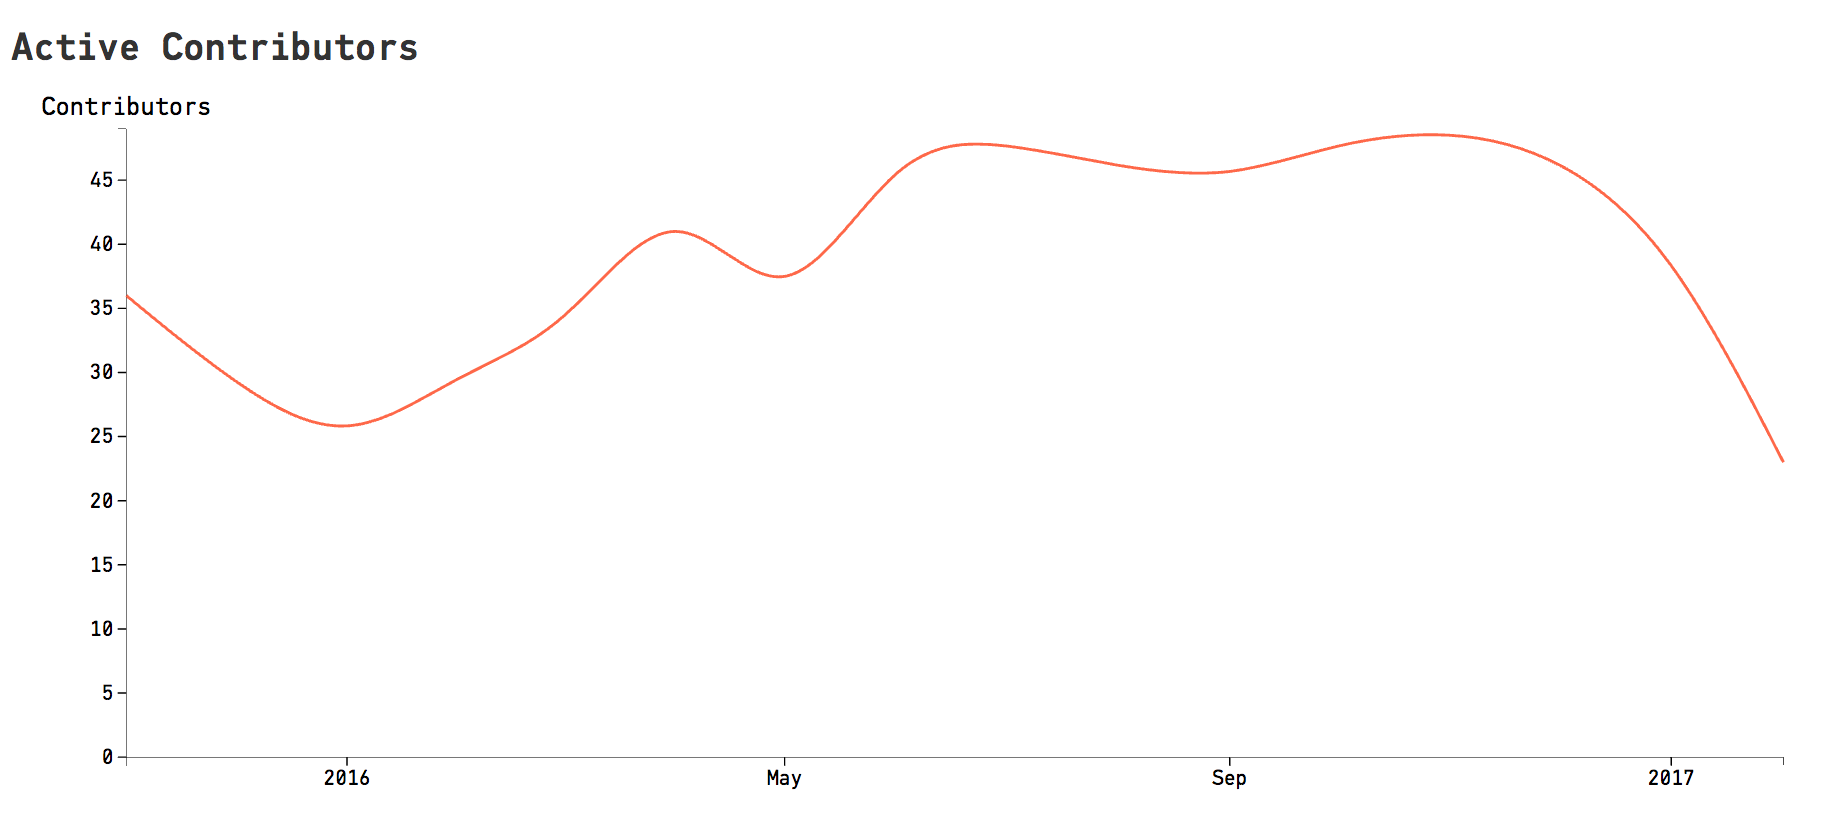
Fig. 88 The number of active contributors over time.
The contribution trend is particularly interesting when correlated with the other churn trends. You may also want to compare the contribution trend with the system complexity trend (see Architectural Analyses). Correlating the number of active contributors to these churn metrics lets you evaluate the effect (or lack thereof) when a project is scaled up or down.
Uncover Long-term Trends in your Code Churn Rolling Average
CodeScene measures two separate churn metrics: the number of added lines of code, and the number of deleted lines. The values in the graph shows the rolling average of your code churn (rolling average is a technique to smooth out sudden fluctuations in your data). You configure a time window for the rolling average in your project configuration.
The main use of these code churn metrics is to reason about delivery risks; If you’re close to a deadline and have a rising churn, you might want to understand why. After all, an increase in churn means that the codebase has become more and more volatile. Unless you have an extensive safety net in terms of tests and continuous deployment techniques, you probably want to stabilize before a release as illustrated in Fig. 89.
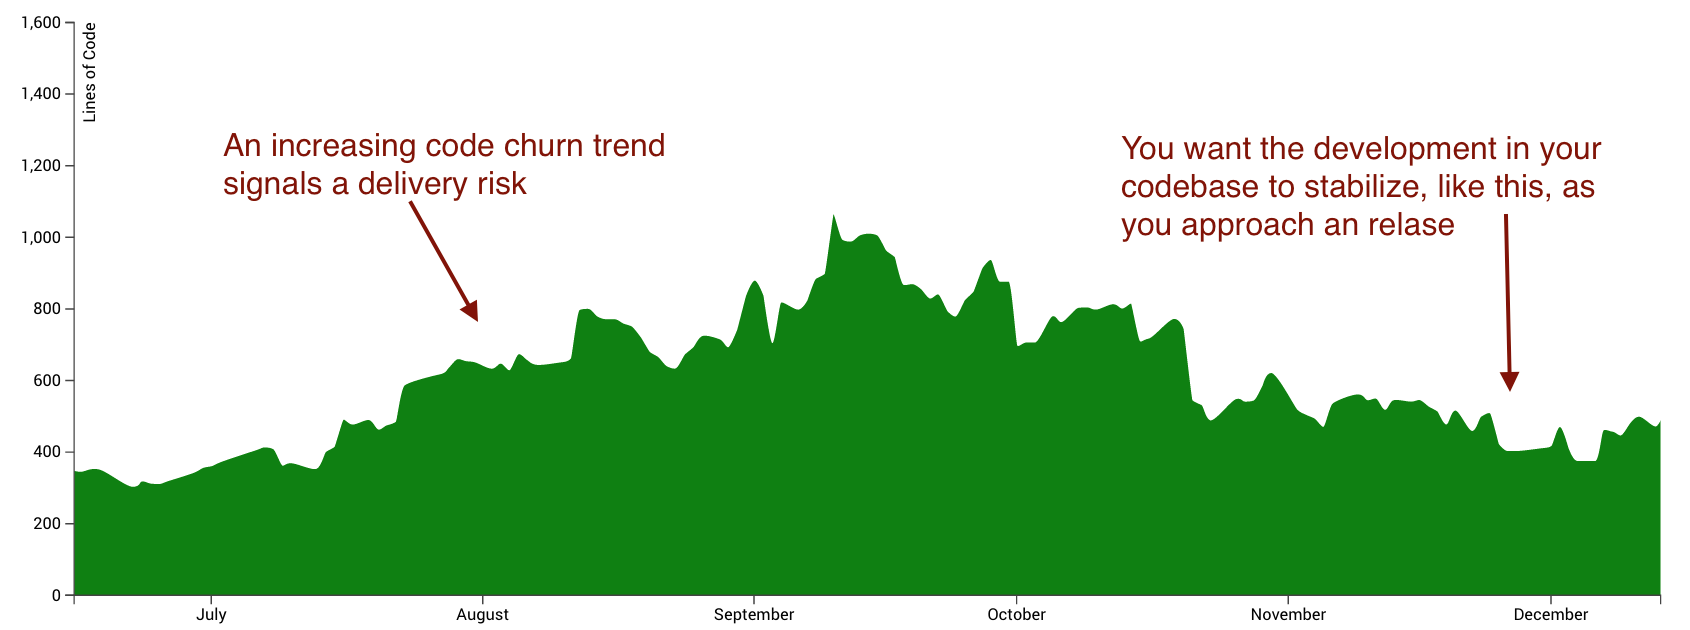
Fig. 89 Use code churn to reason about delivery risk.
Inspect The Level of your Tasks
It’s a challenge to strike the right level when you partition your work into individual tasks. Large tasks are hard to reason about and also less predictable to plan. That’s why we generally prefer small and well-focused tasks.
CodeScene lets you inspect the impact of your project management tasks on the codebase in terms of both code churn and collaboration (that is, how many authors worked together to solve the task?) as illustrated in Fig. 90.
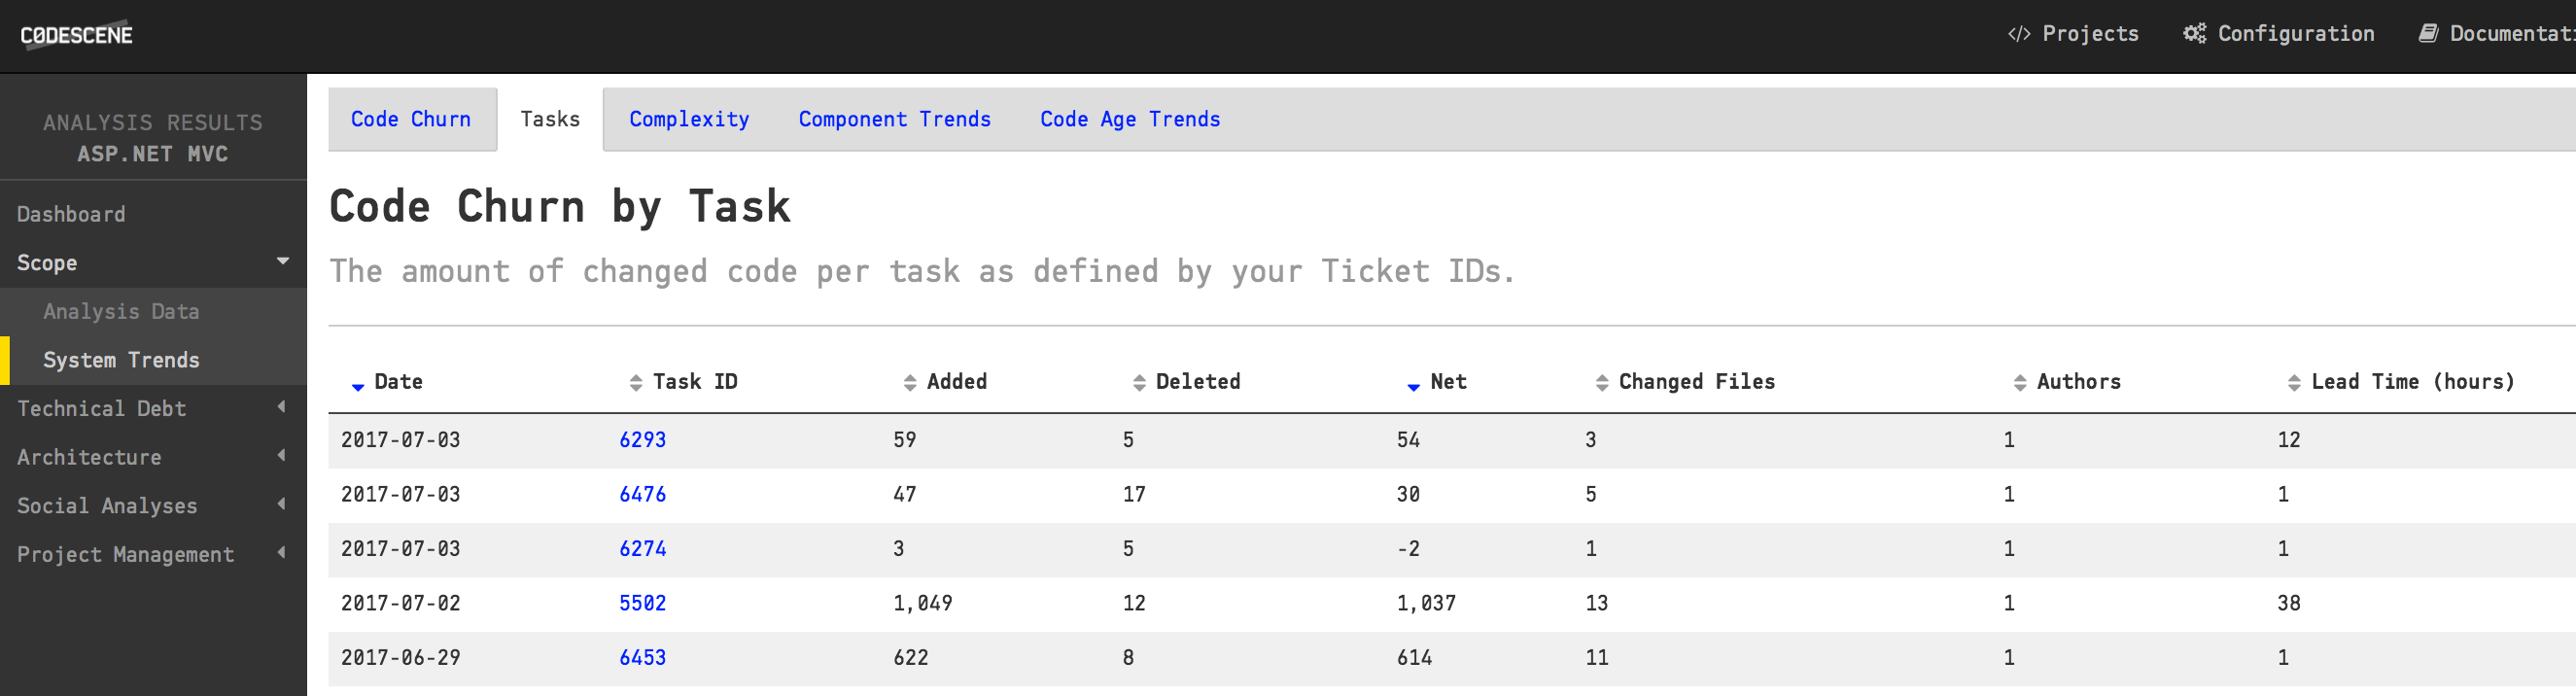
Fig. 90 Inspect the code churn on a task level.
CodeScene uses your Ticket ID to group individual commits into tasks. As you see in Fig. 90, CodeScene also calculates a Lead Time for each task. The lead time is the time that passed between the first and the last commit referencing a specific task. Note that many tasks tend to be solved in a single commit. In that case CodeScene doesn’t have the data to calculate a proper lead time. So CodeScene defaults to one hour in case of a task that’s resolved in a single commit.
We recommend that you use the lead time data to track tasks that drift in time. Often, those tasks suggests requirements that aren’t as well-defined as they could be. You can also use the lead time analysis to track the effects of process changes in your organization.