Code Biomarkers–A Virtual Code Reviewer
In medicine, a biomarker is a measure that might indicate a particular disease or physiological state of an organism. CodeScene’s biomarkers does the same for code. Combined with biomarker trends, this gives you a high level summary on the state of your hotspots and the direction your code is moving in.
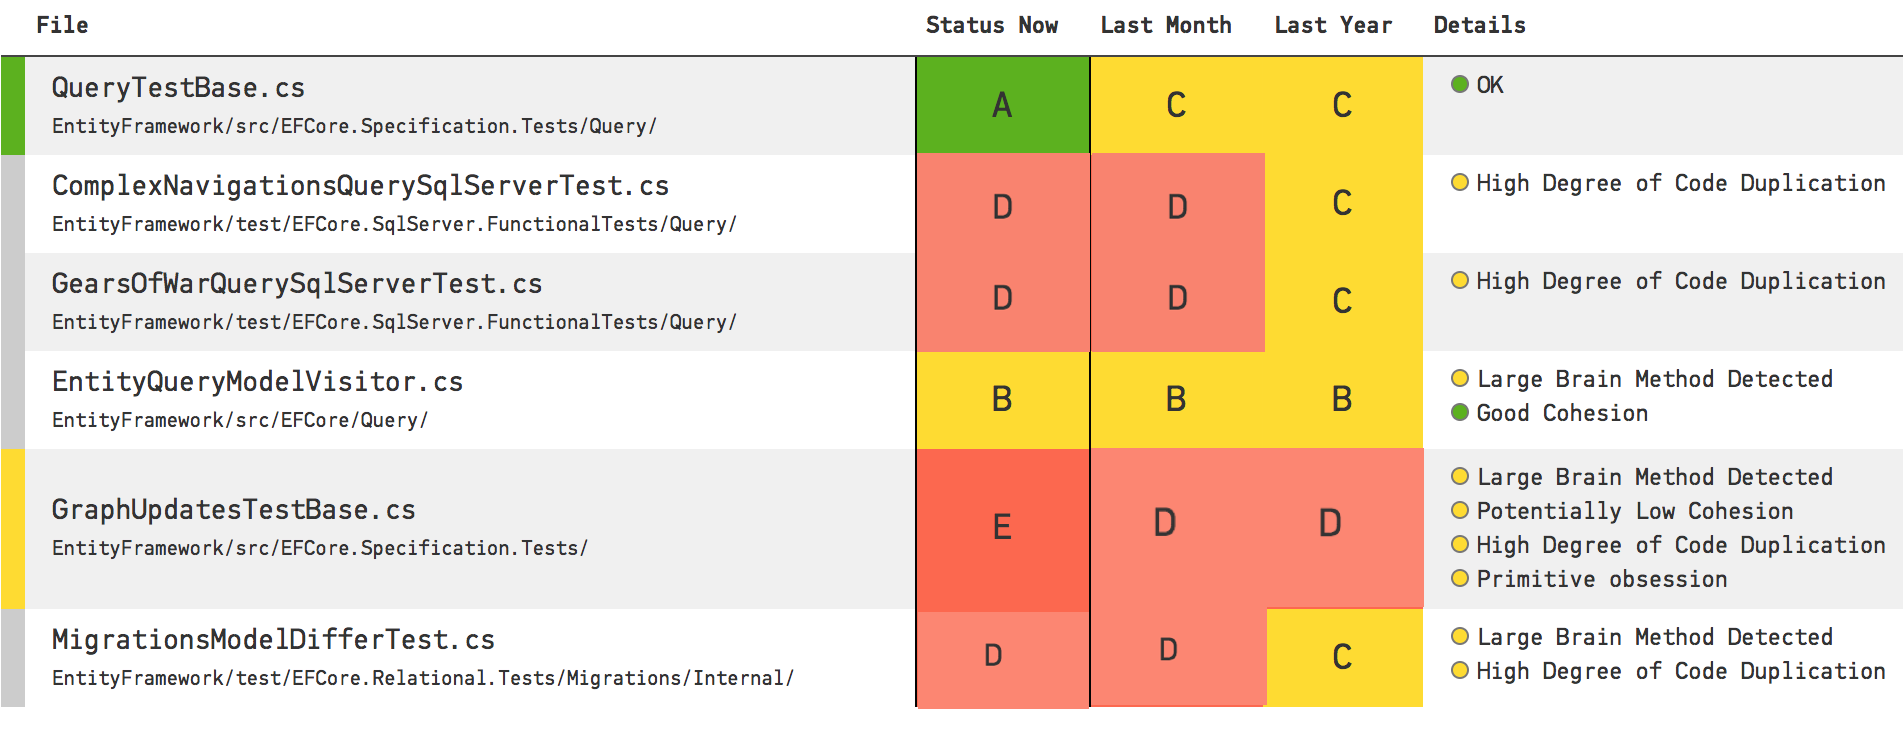
Fig. 30 The Code Biomarkers shows the status of your hotspots at a glance.
CodeScene’s biomarkers are like an extra, virtual team member that constantly reviews your code. Let’s look into the biomarkers.
The Ideas Behind Code Biomarkers
We at Empear make heavy use of CodeScene ourselves. We use the tool as part of our services. Over the past years we have analyzed hundreds of different codebases, and there are some patterns that we have seen repeated over and over again. Thus, we started to implement support in CodeScene to auto-detect those patterns, and we called the feature biomarkers.
The biomarkers name requires a brief explanation. In general, we wanted to avoid terms like “quality” or “maintainability” since they are easy to game and, more serious, suggest an absolute truth. Instead we find that it’s the trend that’s most important: is the code evolving in the desired direction? In addition, an algorithm, no matter how smart, can only take us so far; at some level we want a human in the loop, and the code biomarkers are there to support that human by priming them on what to look for in the specific hotspot. Let’s look at some examples.
Explore your Code’s Biomarkers
If CodeScene has biomarker support for your language (see X-Ray for a list of supported languages), you will get a high-level trend on your dashboard as shown in Fig. 31.
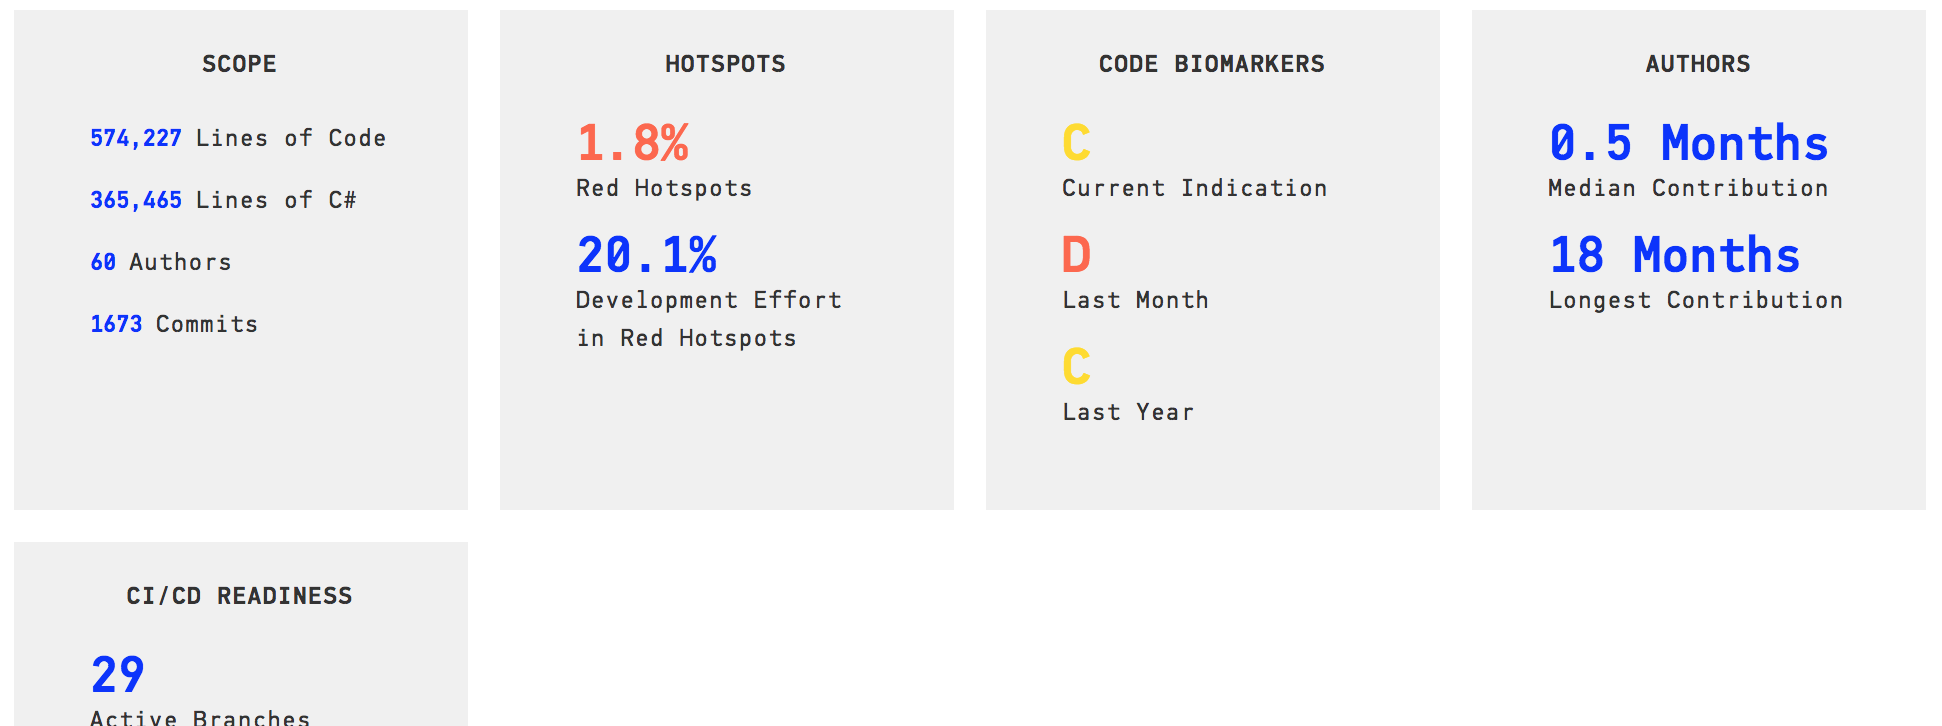
Fig. 31 Code Biomarkers summary on the analysis dashboard.
As you see on the dashboard, code biomarkers are scored from A to E where A is the best and E indicates code with severe potential problems. In this example, we see that this particular codebase has improved over the past month as indicated by the move from a D score to a C.
Biomarkers Present Actionable Metrics
Before we move on, how do we know that the biomarkers and scores are relevant? Well, the biomarkers are built on top of CodeScene’s other metrics and behavioral data. That means we only score the prioritized parts of the codebase, the one’s that are most likely to impact development and maintenance costs as show in Fig. 32.
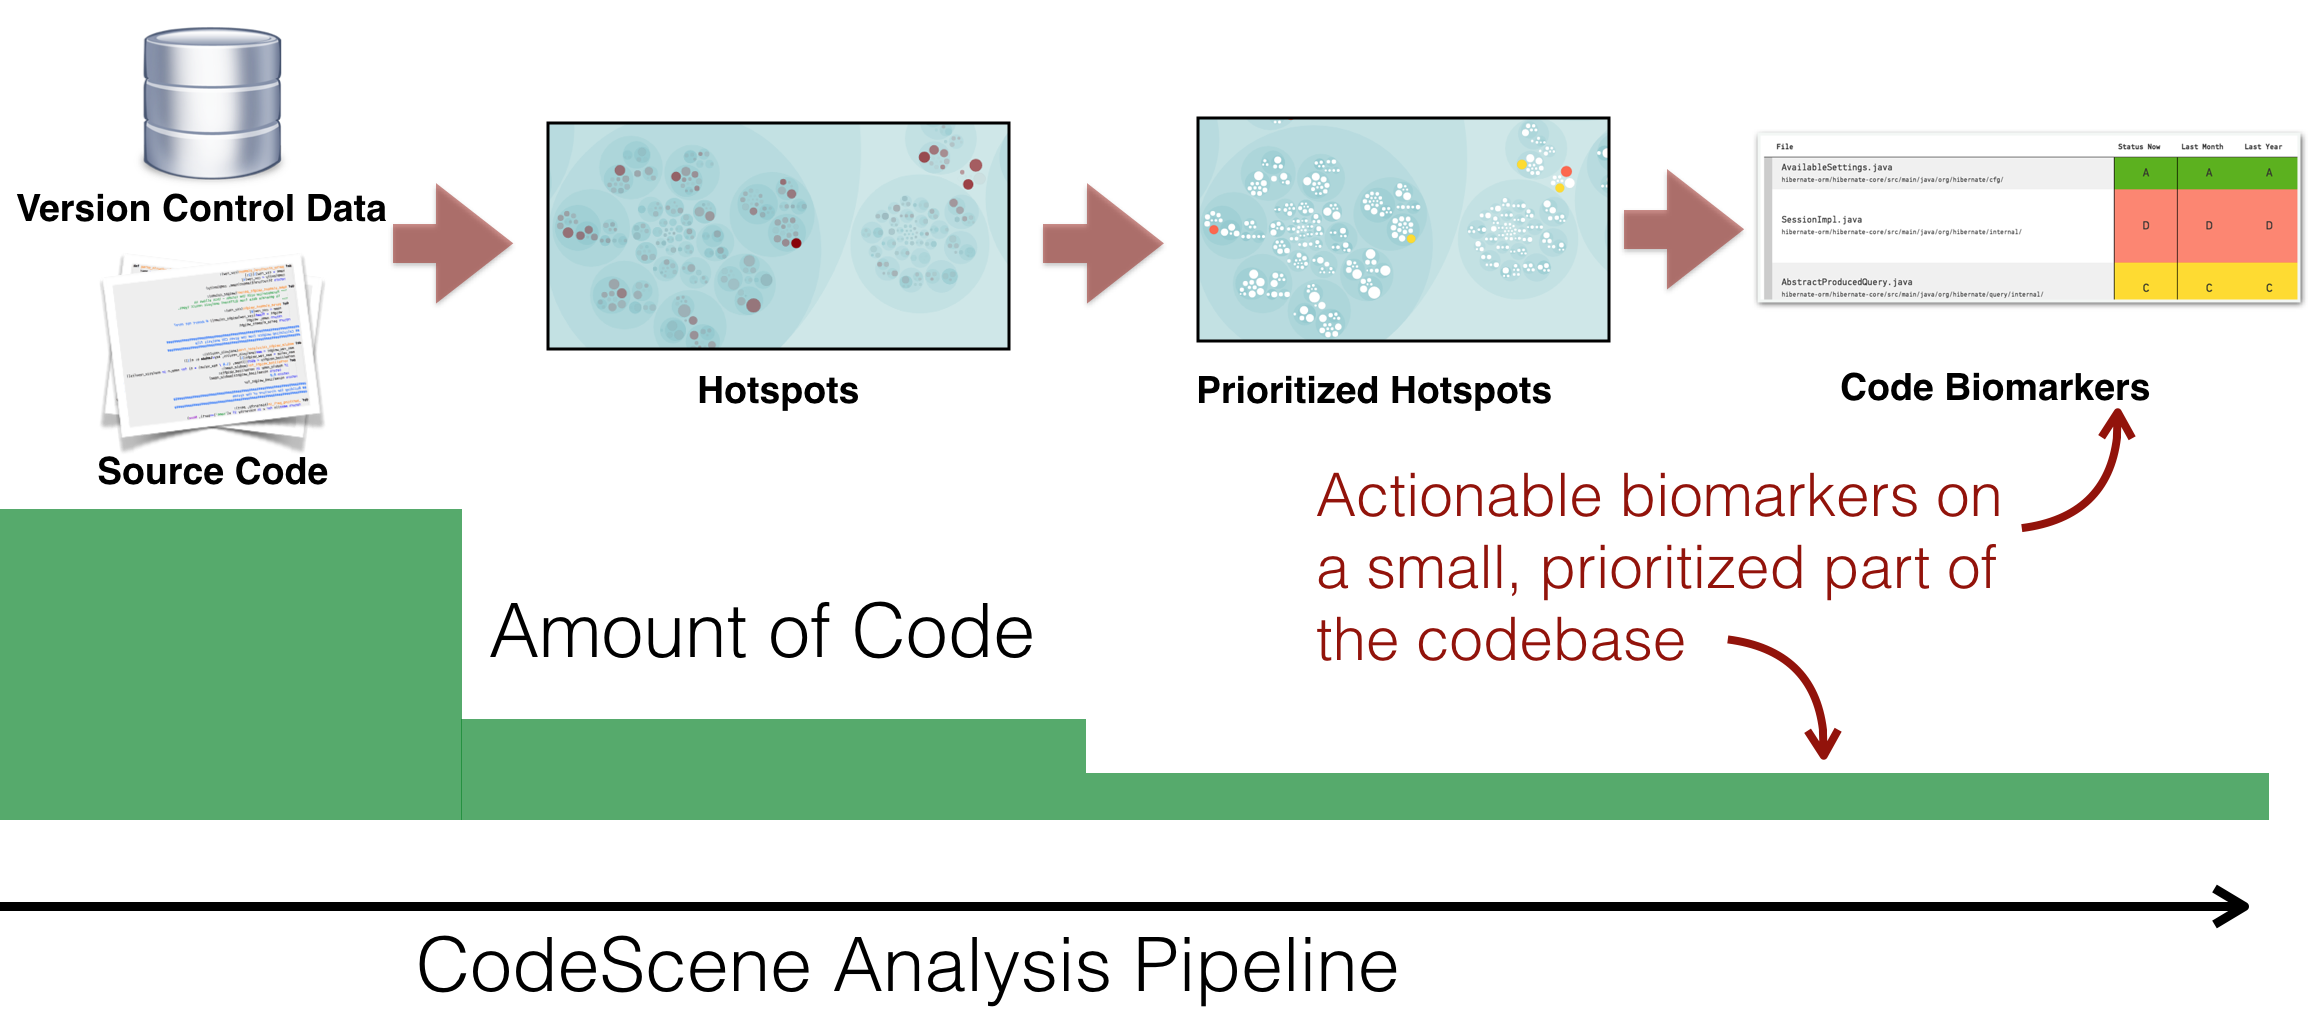
Fig. 32 Biomarkers are built on top of CodeScene’s prioritized hotspots.
Using this principle, Code Biomarkers fill a number of important gaps:
- Bridge the gap between developers and non-technical stakeholders: The biomarkers visualization provides information to managers that help decide on when to take a step back, invest in technical improvements, and measure the effects.
- Get immediate feedback on improvements: The biomarker trends gives you immediate and visual feedback on the investments you do in refactorings.
- Share an objective picture of your code quality: The biomarker scores are based on baseline data from throusands of codebases, and your code is scored against an industry average of similar codebases.
- Get suggestions on where to start refactorings: The code biomarkers hint at specific problems in each file, which also suggests which refactorings that could be used to address the findings.
Let’s demonstrate those properties by having a more detailed look at biomarkers in Fig. 33.
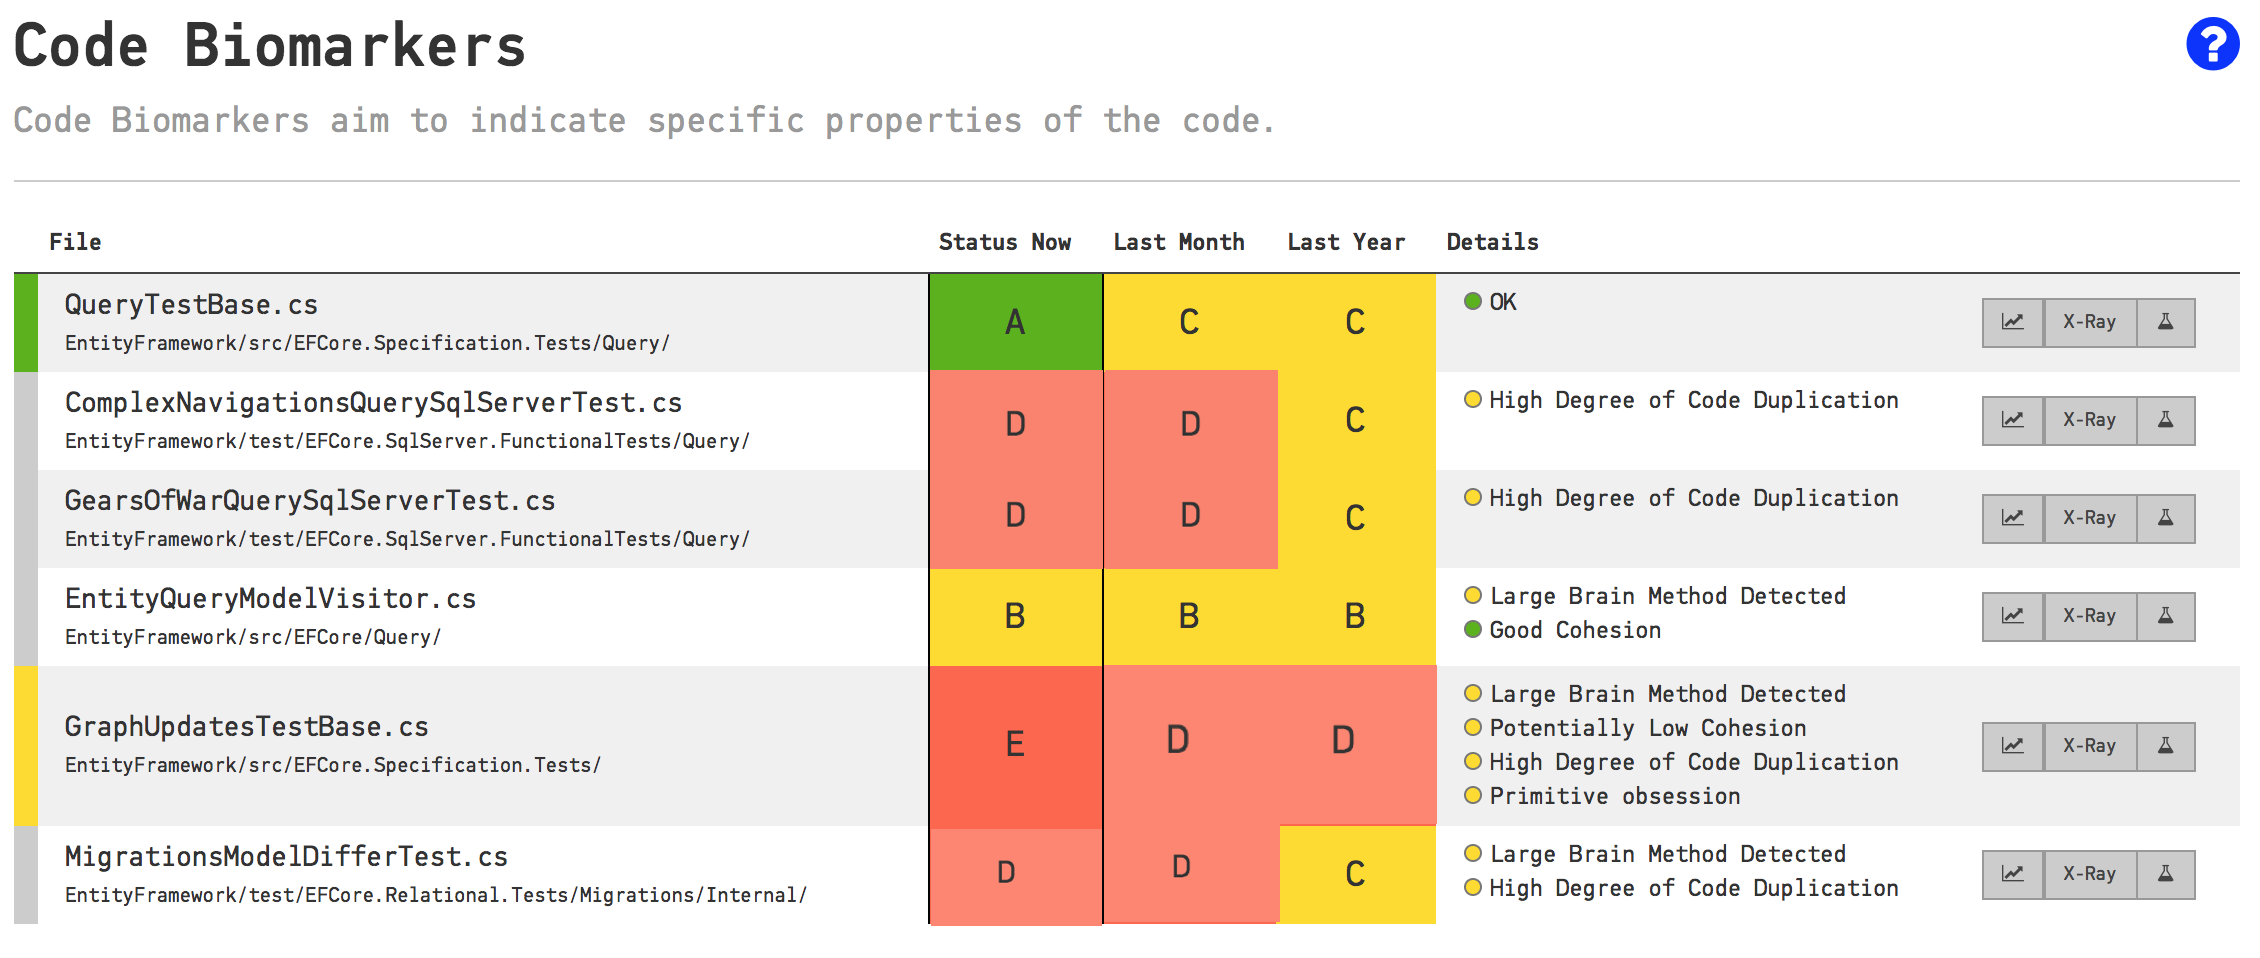
Fig. 33 Detailed Biomarkers for a specific project.
The biomarkers in Fig. 33 provide detailed indications for each prioritized hotspot. We note that the file QueryTestBase.cs has been sucessfully refactored since last month. We also note the warning sign for GraphUpdatesTestBase.cs (see the yellow marker to the lef in the figure), which has degraded from a D to an E.
We get more details when we click on the biomarker button, the lab bottle, next to each hotspot as shown in Fig. 34.
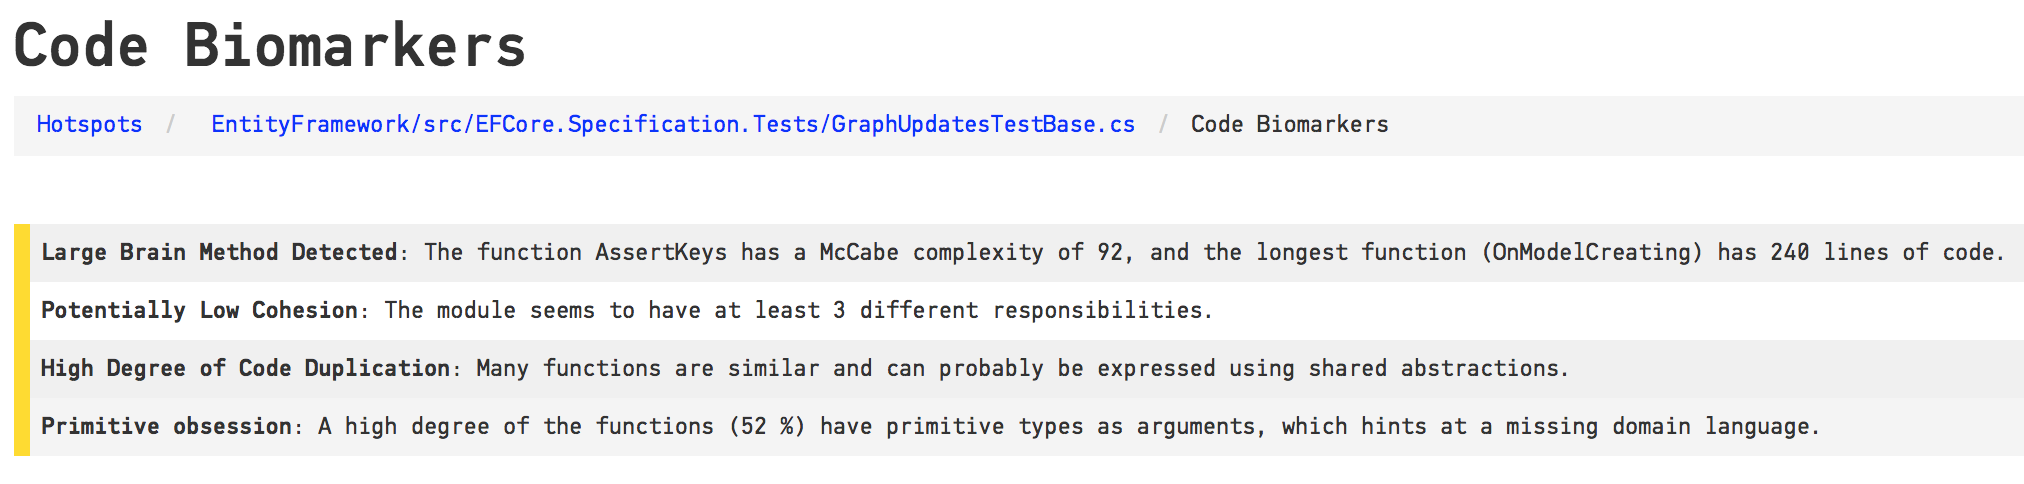
Fig. 34 Detailed Biomarkers for a specific hotspot.
Use the detailed biomarkers to initiate refactorings. For example, the next step in this case would be to simplify the Brain Methods OnModelCreating and AssertKeys by applying the Extract Method refactoring repeatedly to reveal the overall intent of those methods. The next step could be to address the reportedly low cohesion; CodeScene suspects that QueryTestBase.cs has three separate responsibilites, so splitting the file into three separate modules will improve the design and limit the cognitive load on the developers who work with the code. Finally, we could investigate the code duplication reported by a biomarker. Duplicated code usually hints at one–or more–missing abstractions that we could introduce. Hence, we recommend to run an X-Ray analysis on the file to get more insights now that we know what to look for. We show an example of a QueryTestBase.cs X-Ray in Fig. 35.
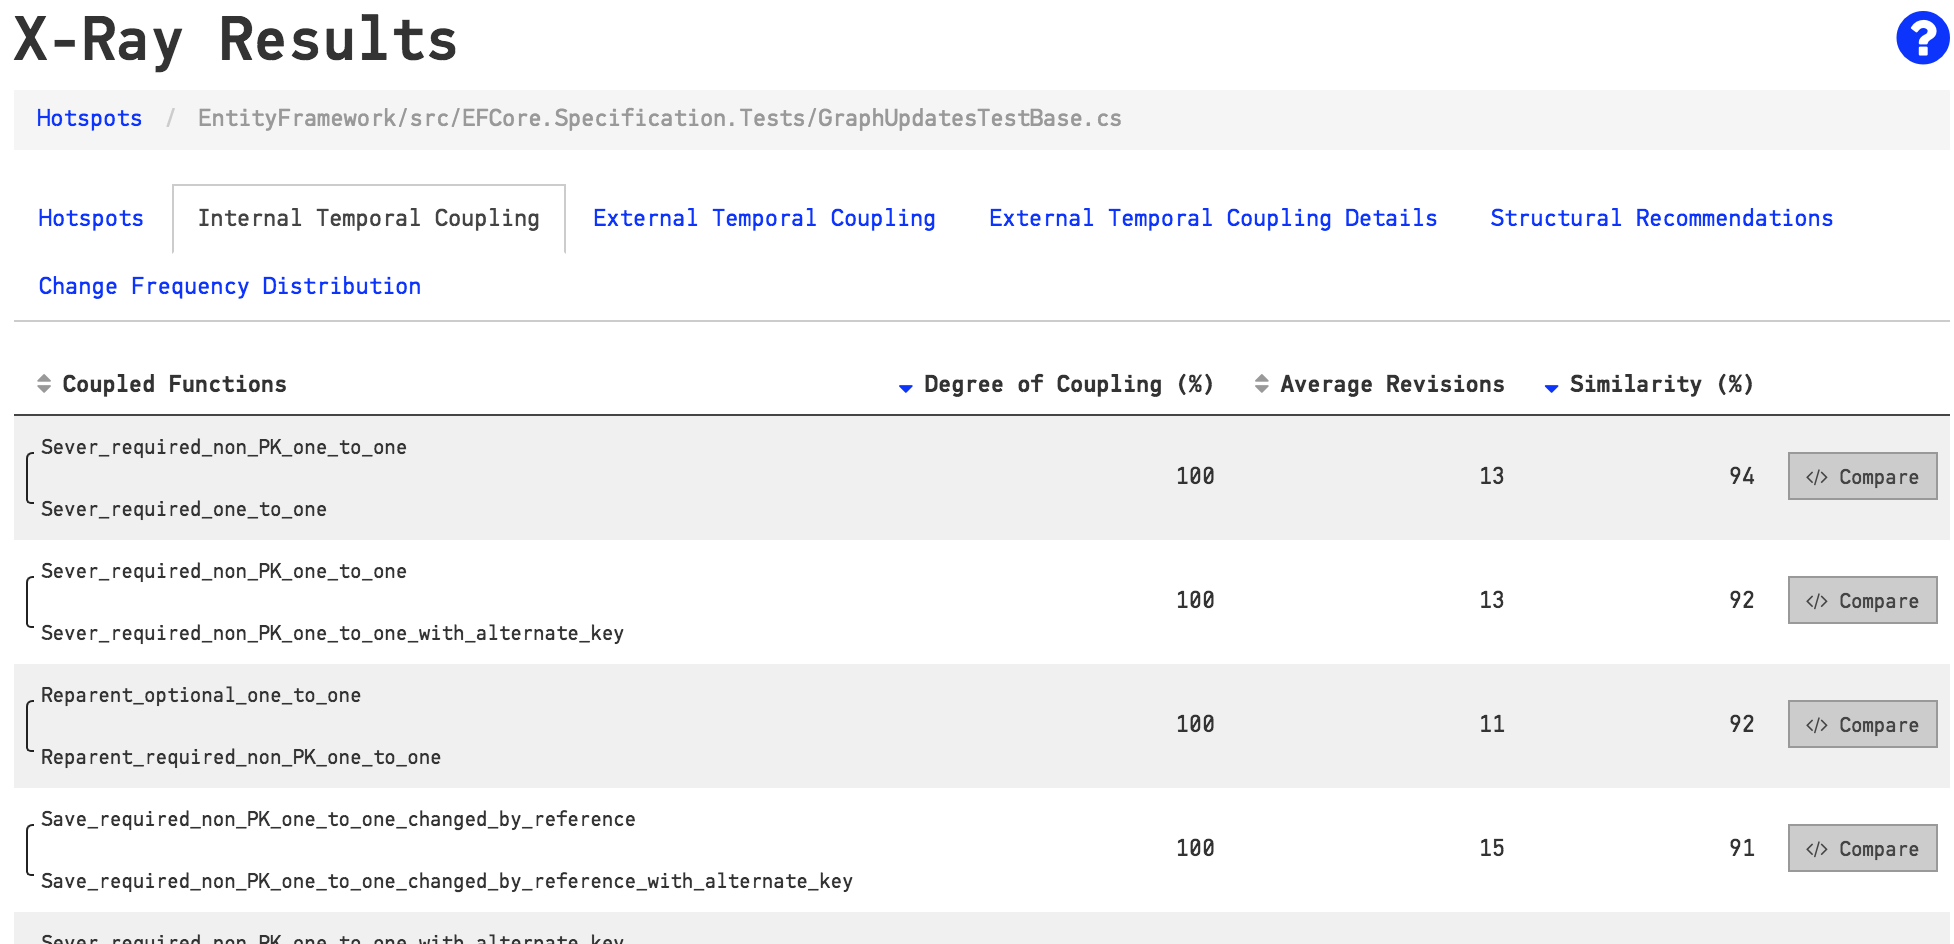
Fig. 35 Use X-Ray to follow-up on the biomarkers.
We’ll return to our discussion on how to act upon the biomarker indications towards the end of this guide. Before we get there, it’s important to note that CodeScene includes social biomarkers too. You see an example on this in Fig. 36.
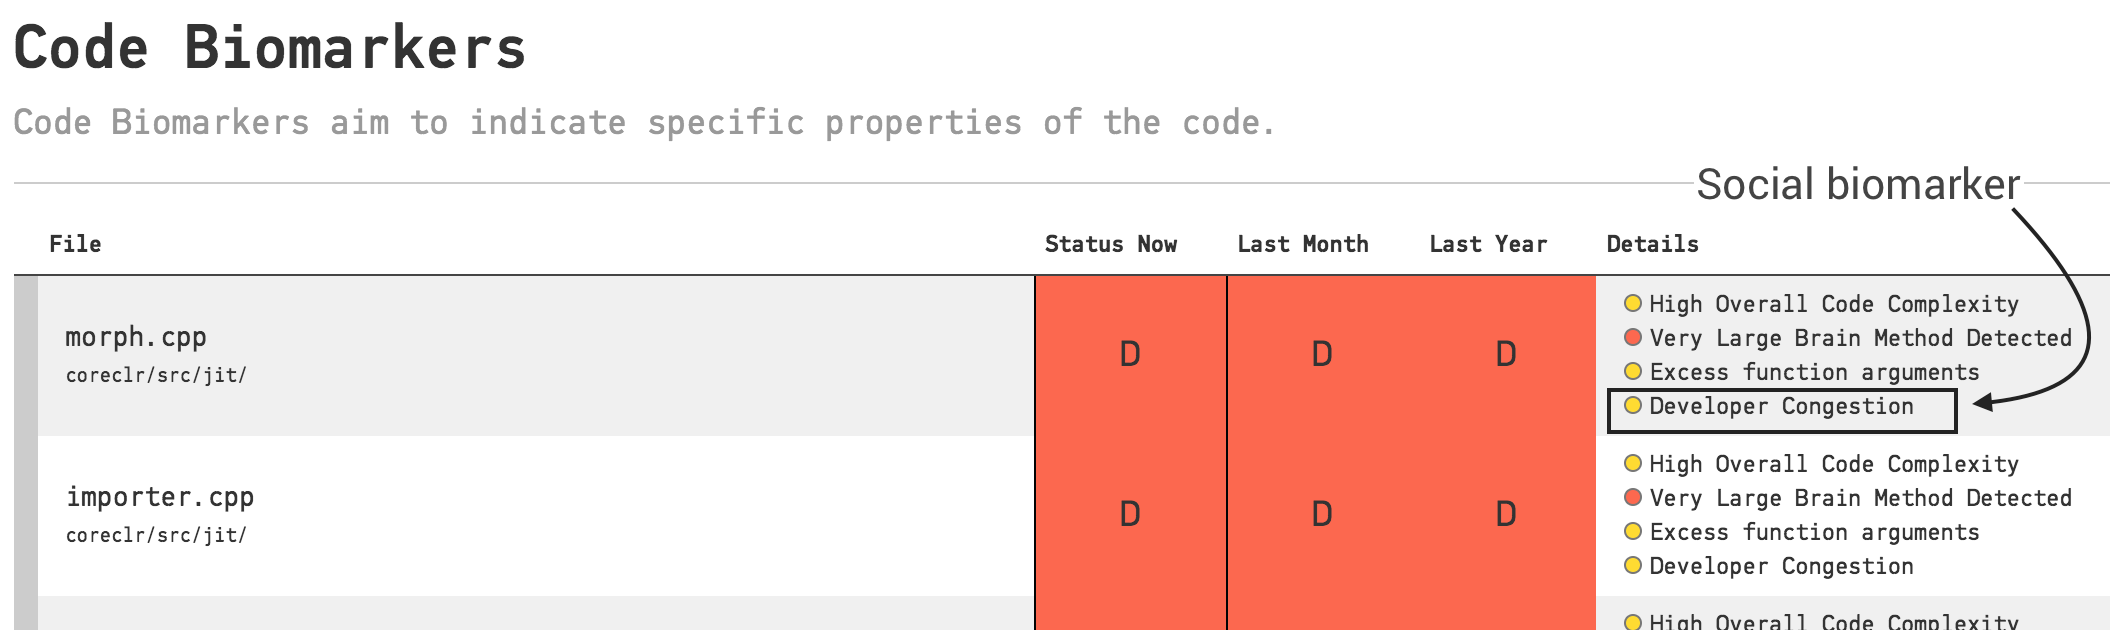
Fig. 36 Social Biomarker indication found in a specific hotspot.
In this case, CodeScene noted that seven separate developers have worked on the code over the past weeks, and this fragmentation (see Parallel Development and Code Fragmentation) puts the code at risk for defects and unexpected feature interactions. A high developer congestion might also make the code harder to understand since any mental models we have of the code are likely to become outdated fast due to the massive parallel work on the code.
Launch the Virtual Code Reviewer to Get a Holistic View of Hotspots
You can launch a virtual code reviewer for any file. The virtual code review will aggregate the most significant metrics for your chosen file, as seen in Fig. 20.
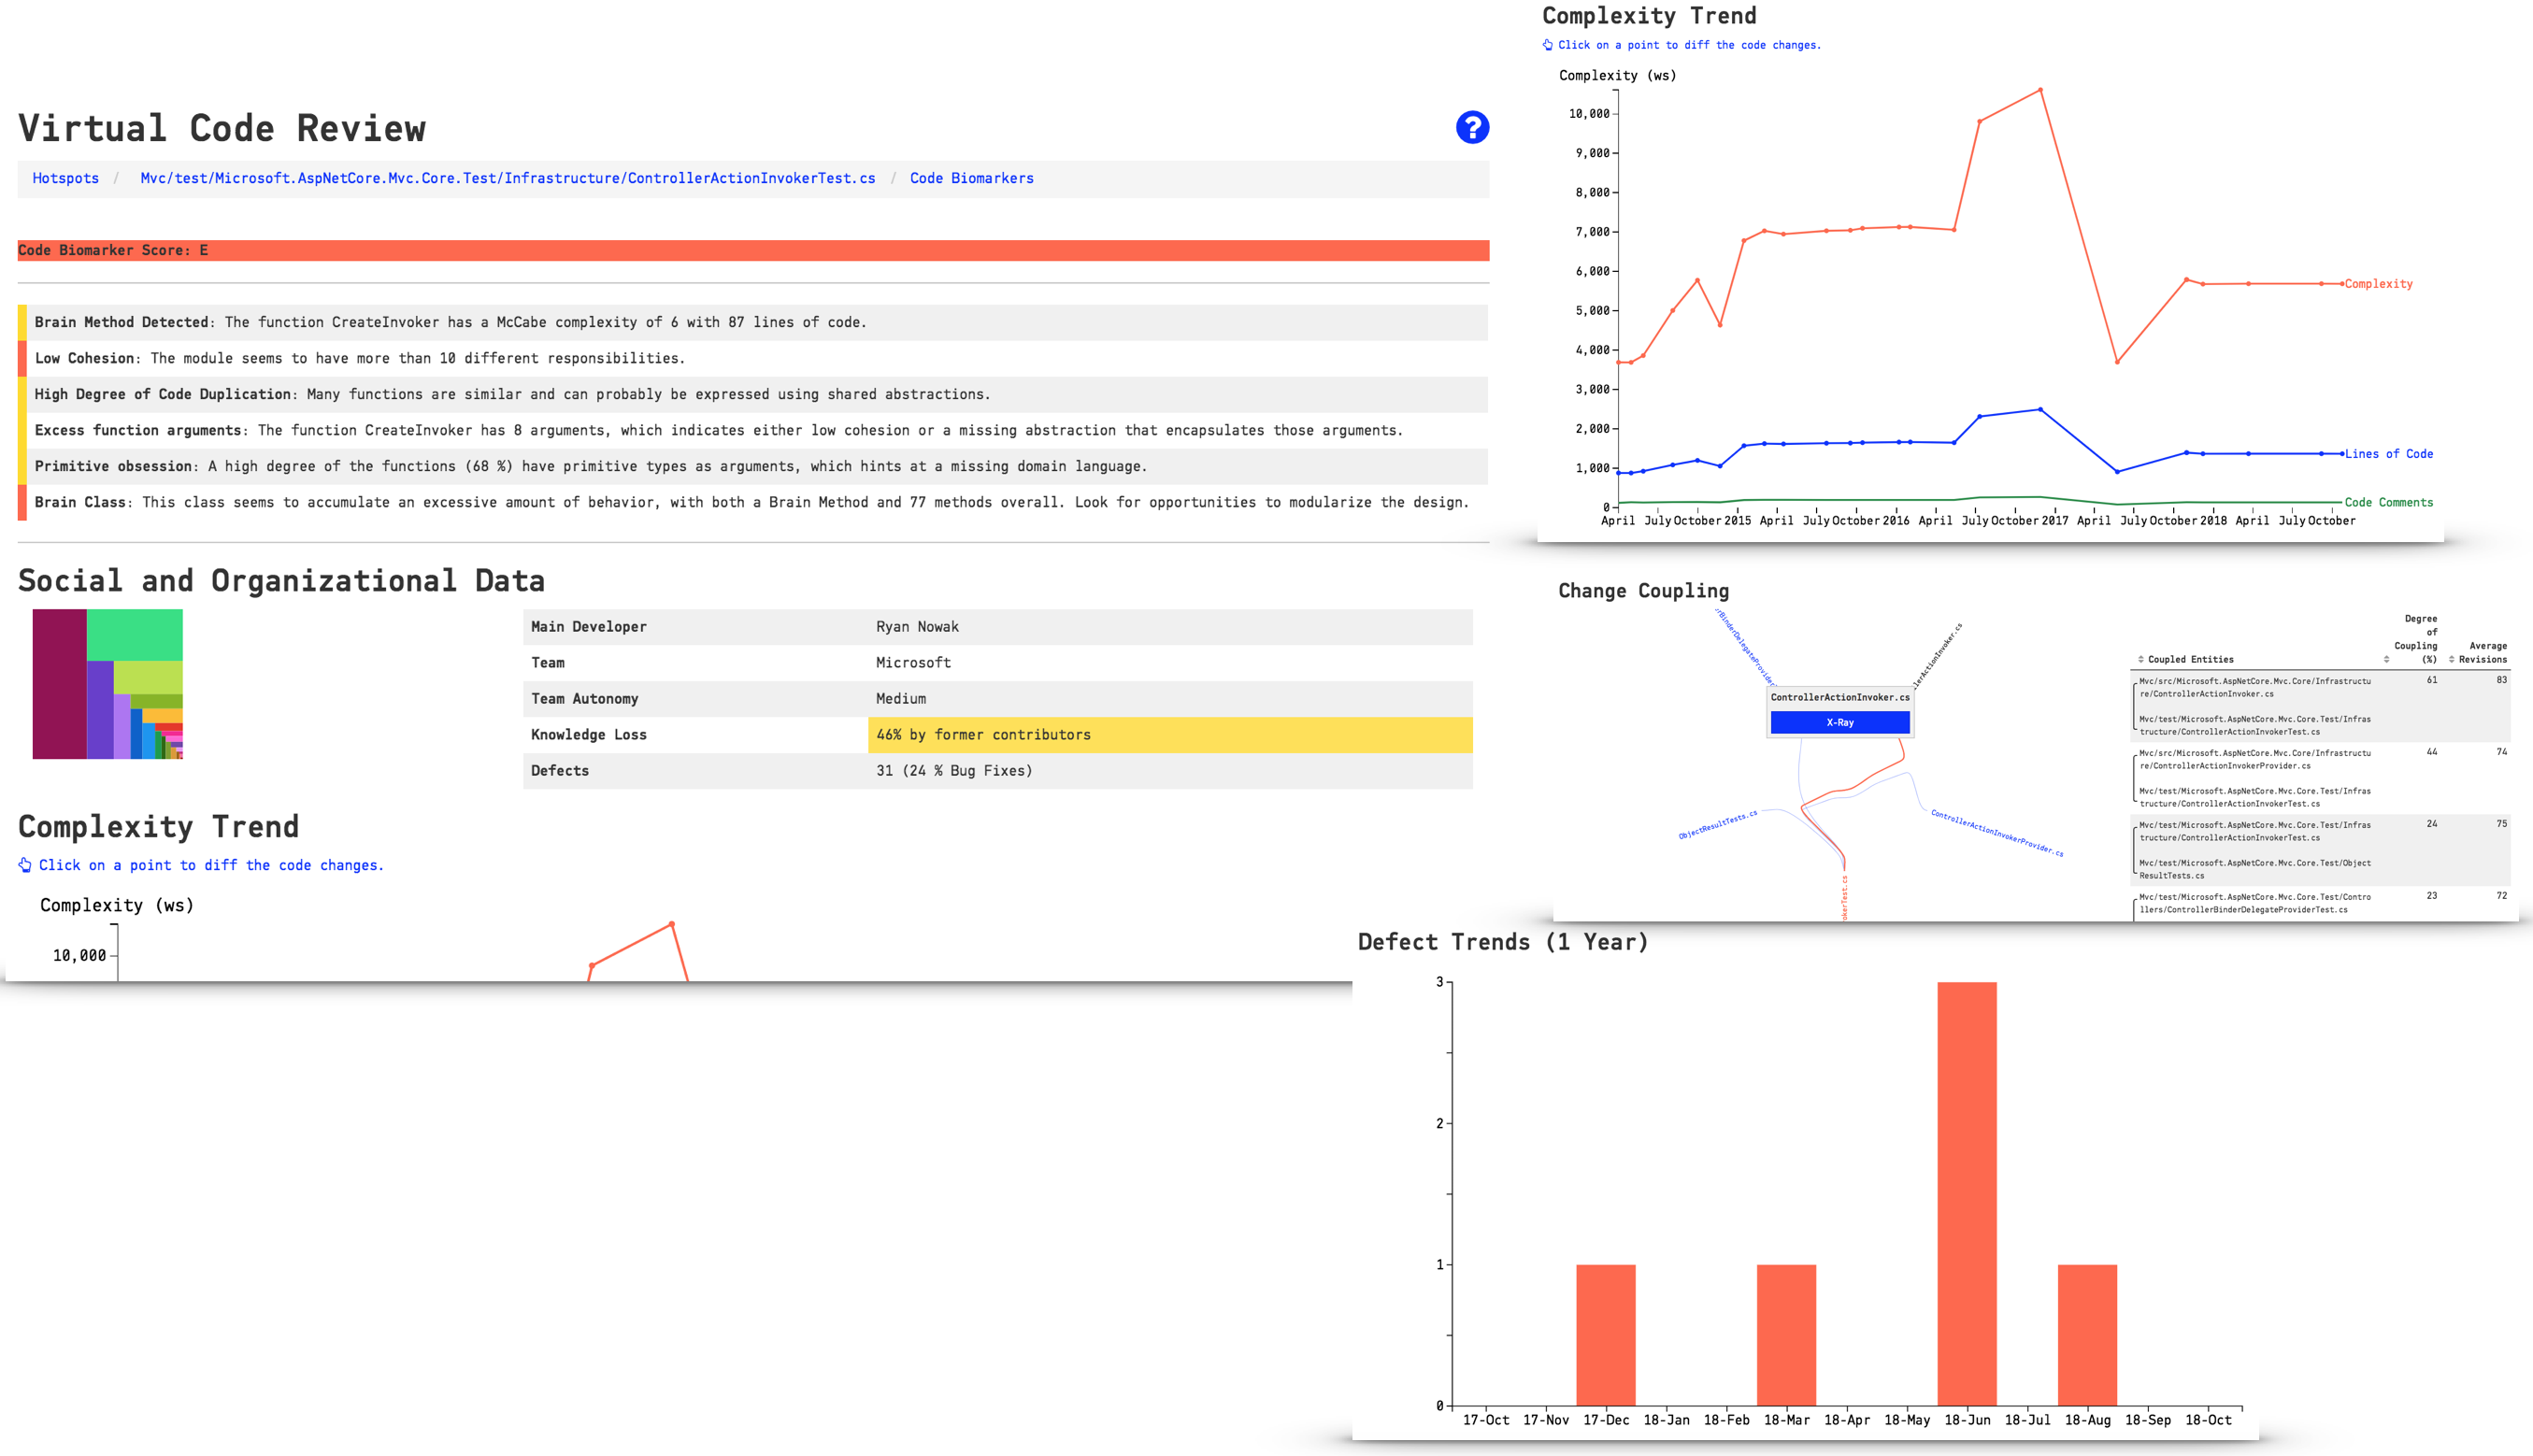
Fig. 37 Get a holistic overview of your hotspot.
The virtual code reviewer combines the social and technical analysis data you need to assess the severity of the biomarker findings:
- Review the detailed biomarker indications to spot maintenance and quality issues.
- Detect potential inter-team coordination bottlenecks that should drive refactorings through the social metrics such as the team autonomy measure.
- See if it’s a growing problem in the Complexity Trend.
- Investigate the change coupling, filtered for your selected file under review.
- Use the defect trend to estimate the cost of any technical or social debt you might find in the review.
Augment Hotspots to let CodeScene Supervise them
Once you have inspected a hotspot you can augmented the analysis with your observations. In addition, an augmented analysis lets you categorize your findings so that CodeScene can supervise and guide you based on the technical debt you identify. This augmented analysis provides a complete framework for managing technical debt and is described in detail in Augmented Analysis with Intelligent Notes
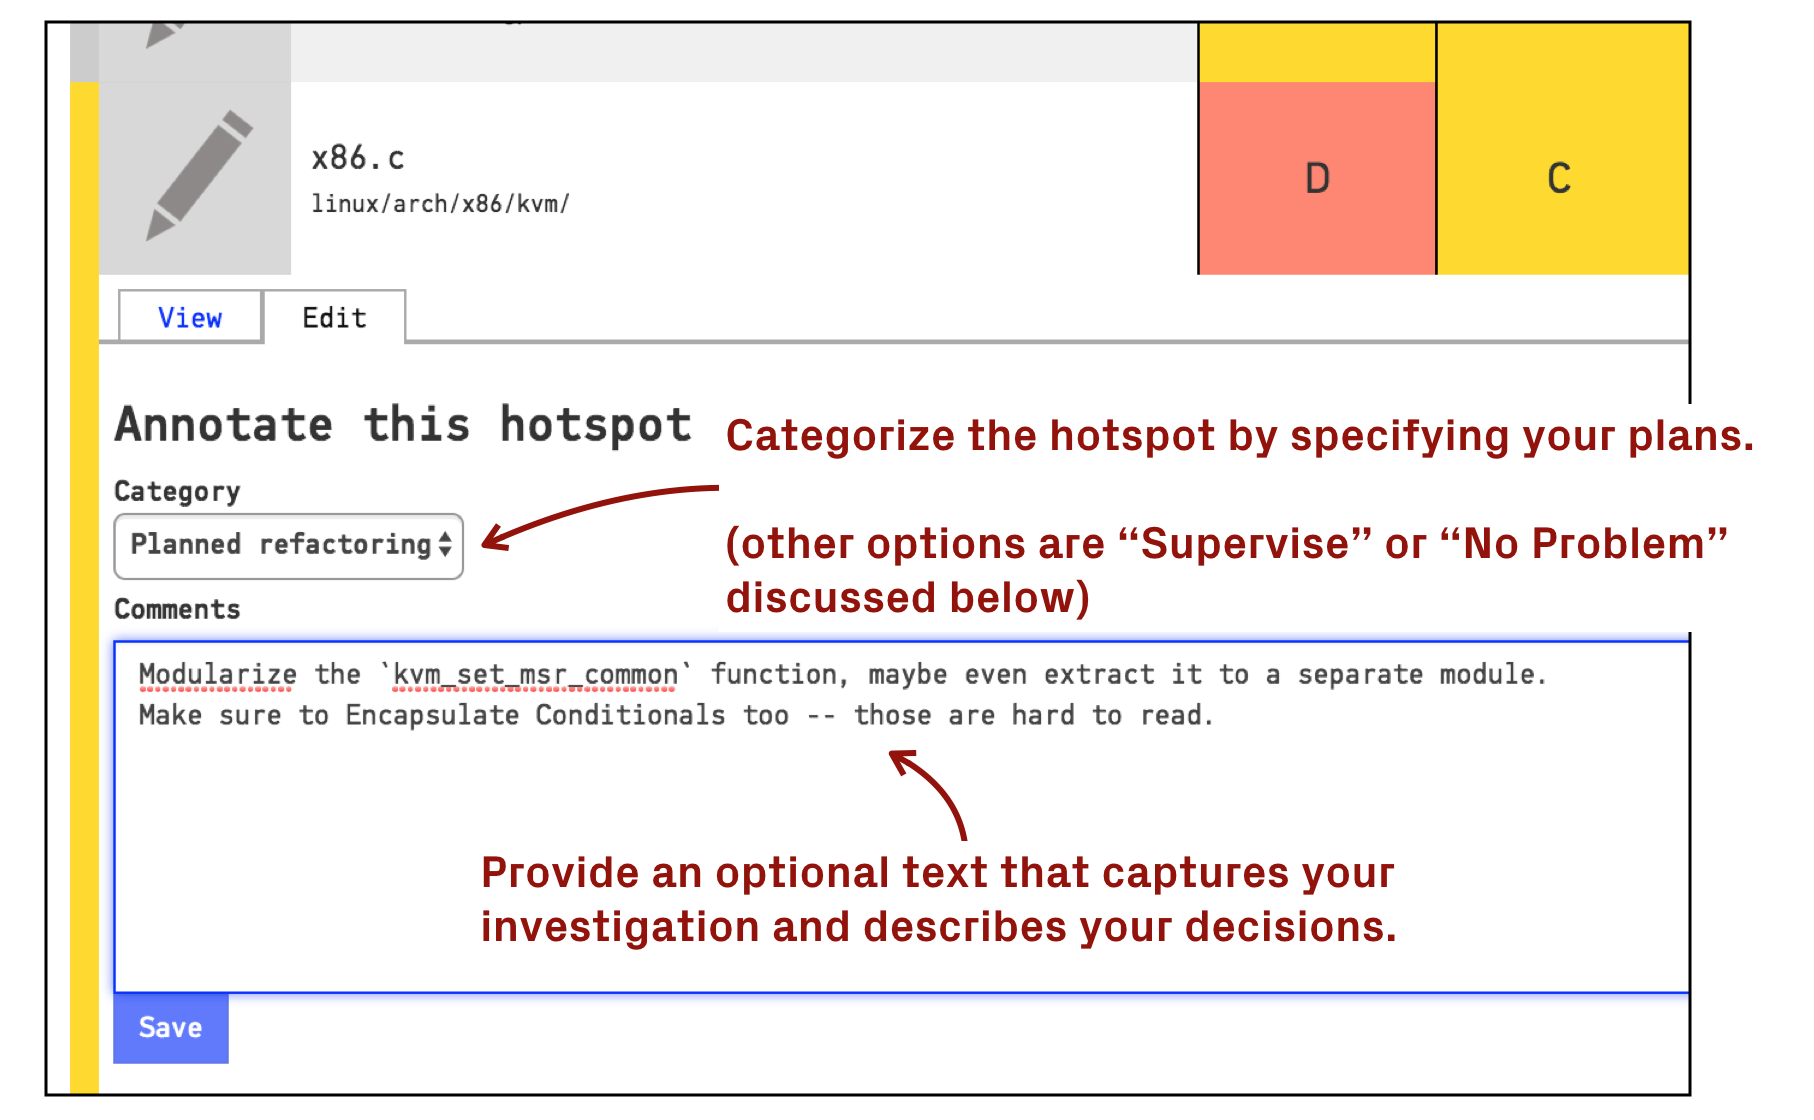
Fig. 38 Add an intelligent note to any hotspot in the Code Biomarkers view.
Display the Biomarkers Monitor
CodeScene presents an additional monitor view where the biomarkers are continuously updated with the status of your ongoing work. Present the view on a TV in the office and use the information to communicate a shared understanding on the state of the codebase as shown in Fig. 39.
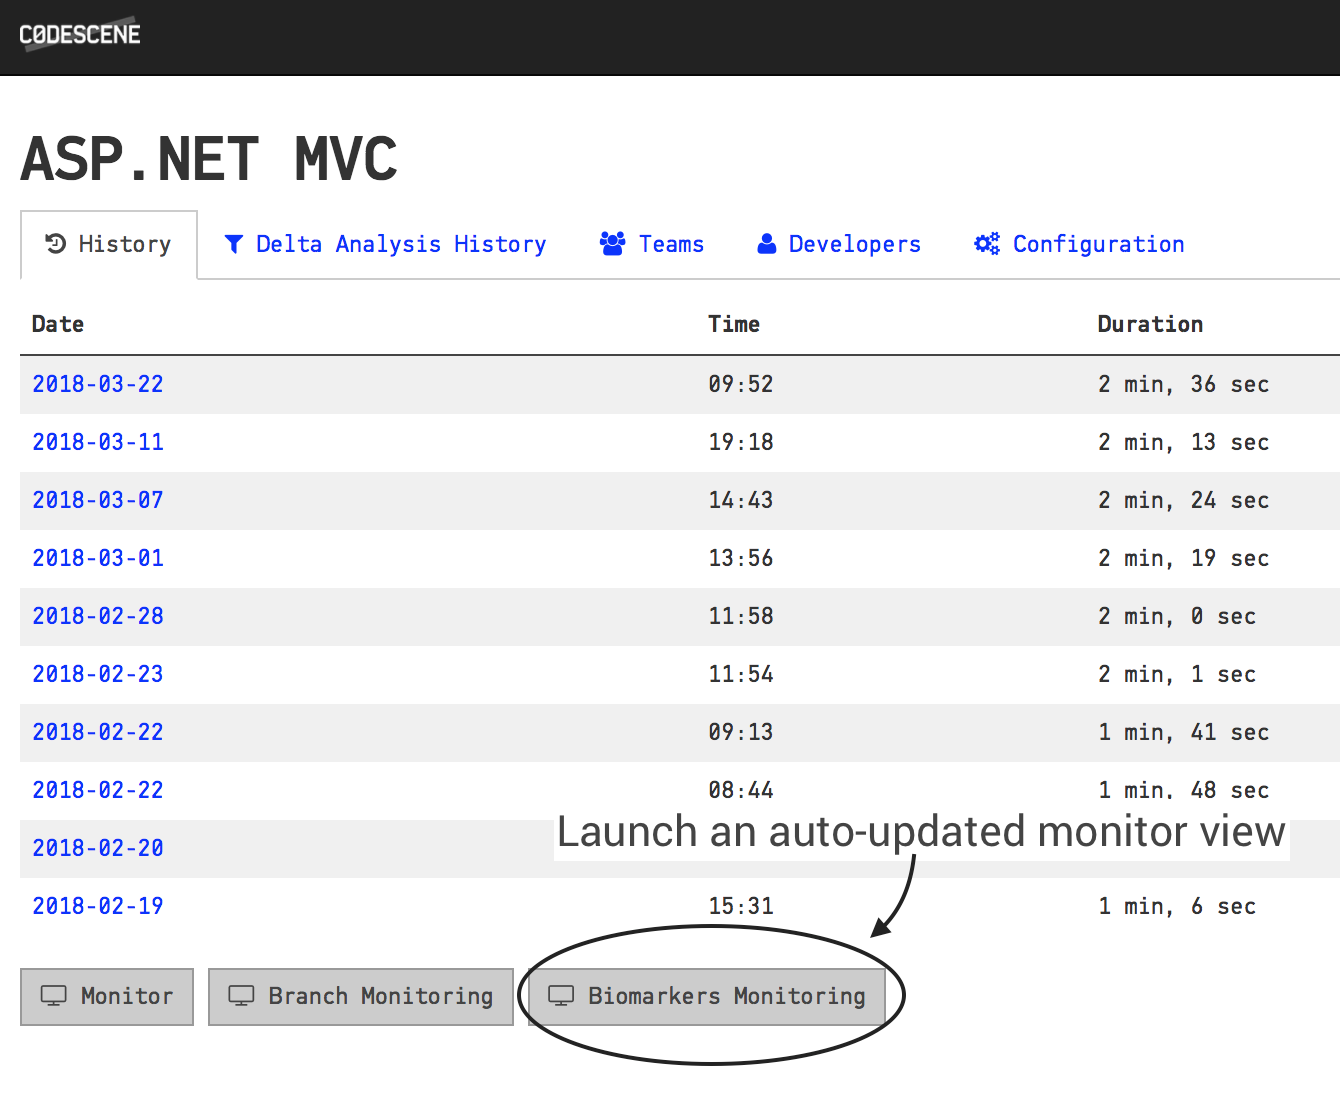
Fig. 39 Display an always up-to-date view of your biomarkers.
Auto-Detect Degrading Biomarkers with Continuous Integration
CodeScene’s delta analysis lets you supervise your biomarkers as part of a continuous integration pipeline. This lets you auto-detect files that seem to degrade in quality through issues introduced in the current commit or pull request. See Use a Delta Analysis to Save Time in Code Reviews for more details.
The Future of Code Biomarkers
This is an early release of the biomarkers concept. We have been using them internally for our services and found that the biomarkers saves us a lot of time and manual inspections. That’s why we decided to include them in the product too and share them with you.
We plan to extend the biomarker support to more programming languages. We also have prototypes for serveral other types of markers that we can detect in the evolution of code, so the concept is likely to expand over the next releases. In addition, we also plan to provide more detailed trends and information on each detected biomarker.
As always, if you lack support for a particular language, please let us know and we’ll try to support it.