Hotspots
Hotspots are the workhorse of software analyses and our recommended starting point as you explore your codebase.
What is a Hotspot?
Your development activity tends to be located to relatively few modules as illustrated in Fig. 16. A Hotspot analysis helps you identify those modules where you spend most of your time. This is information you use to improve the parts that really matter. The parts where you’re likely to get a return on your investment.
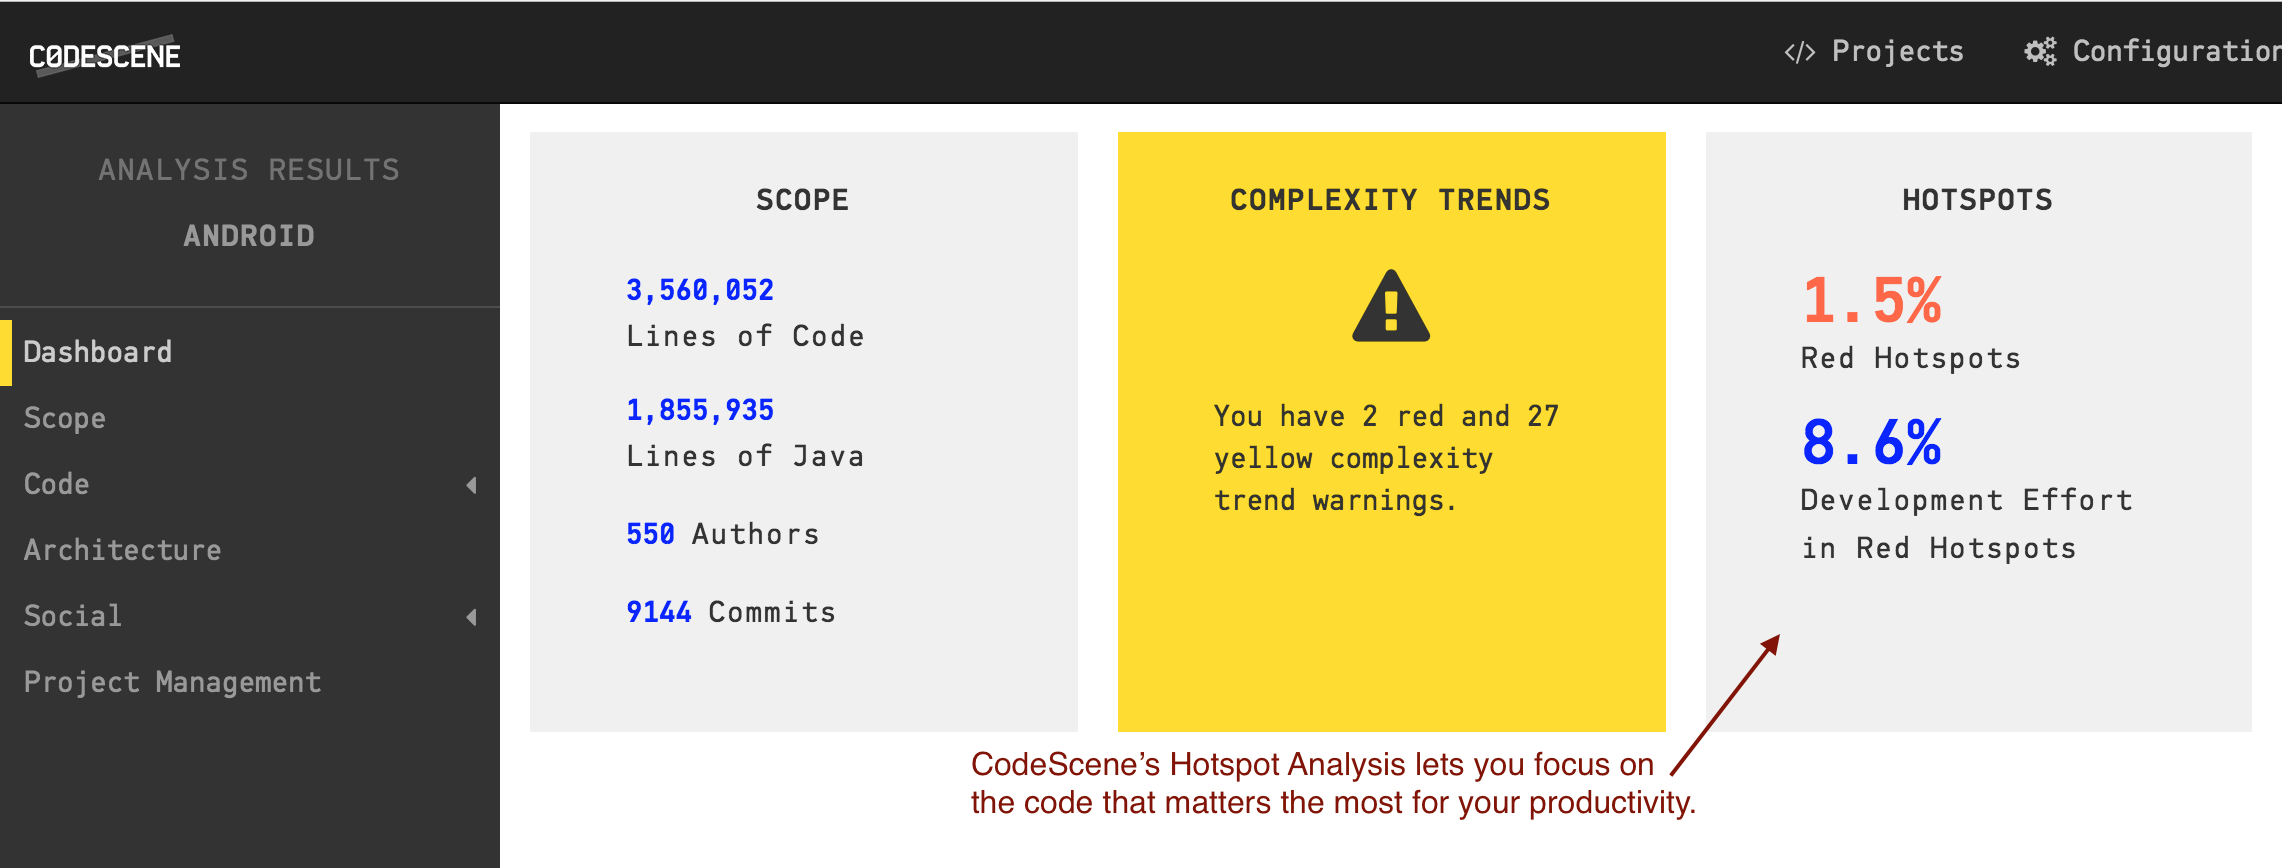
Fig. 16 The dashboard gives you a high-level overview of the Hotspot activity in your code.
A hotspots is complicated code that you have to work with often.
Explore the Hotspot Activity
CodeScene lets you explore the overall Hotspot activity in your code. These Hotspots are calculated from two different data sources:
- We use the lines of code in each file as a proxy for complexity.
- We use the change frequency of each file as a proxy for the effort you’ve spent on that code.
You want to look for an overlap between the two metrics. That’s why CodeScene presents an easy to explore, interactive visualization of your hotspots. Fig. 17 shows an example from the Visual Studio Code codebase.
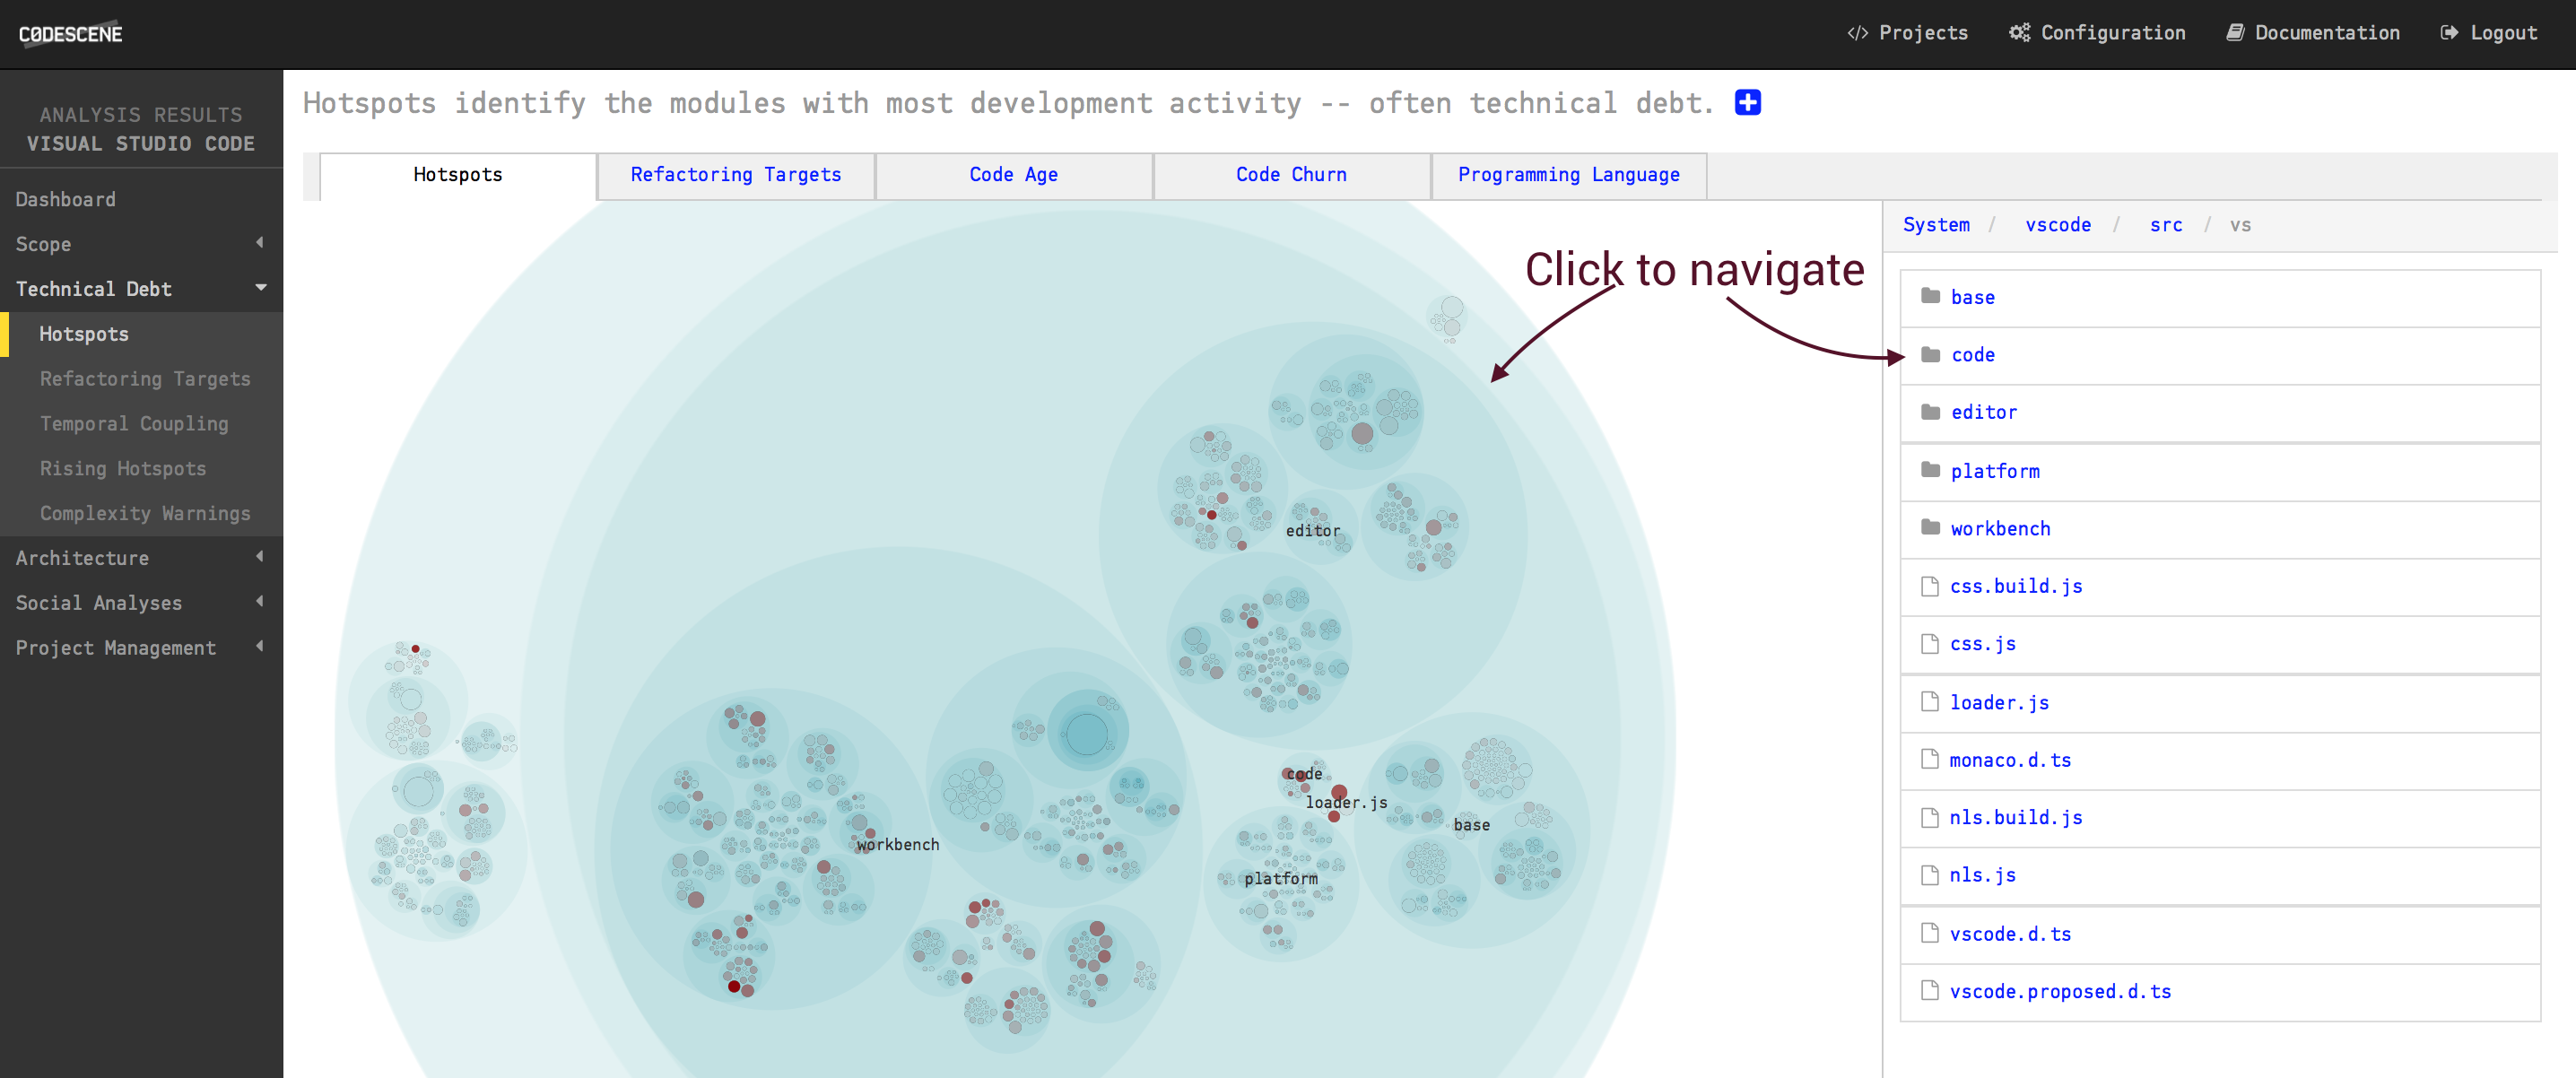
Fig. 17 Hotspots in the Visual Studio Code codebase.
The Hotspot visualization makes it easy to identify the parts of your code where most development effort is spent. In a larger codebase you want to let CodeScene identify your refactoring targets. Let’s see how that’s done.
Focus on your Refactoring Targets
To prioritize your hotspots, CodeScene employs algorithms that look at deeper change patterns in the analysis data. The rationale is that complicated code that changes often is more of a problem if:
- The hotspot has to be changed together with several other modules.
- The hotspot affects many different developers on different teams.
- The hotspot is likely to be a coordination bottleneck for multiple developers.
This algorithm allows CodeScene to rank and prioritize the hotspots in your codebase as illustrated in Fig. 18.
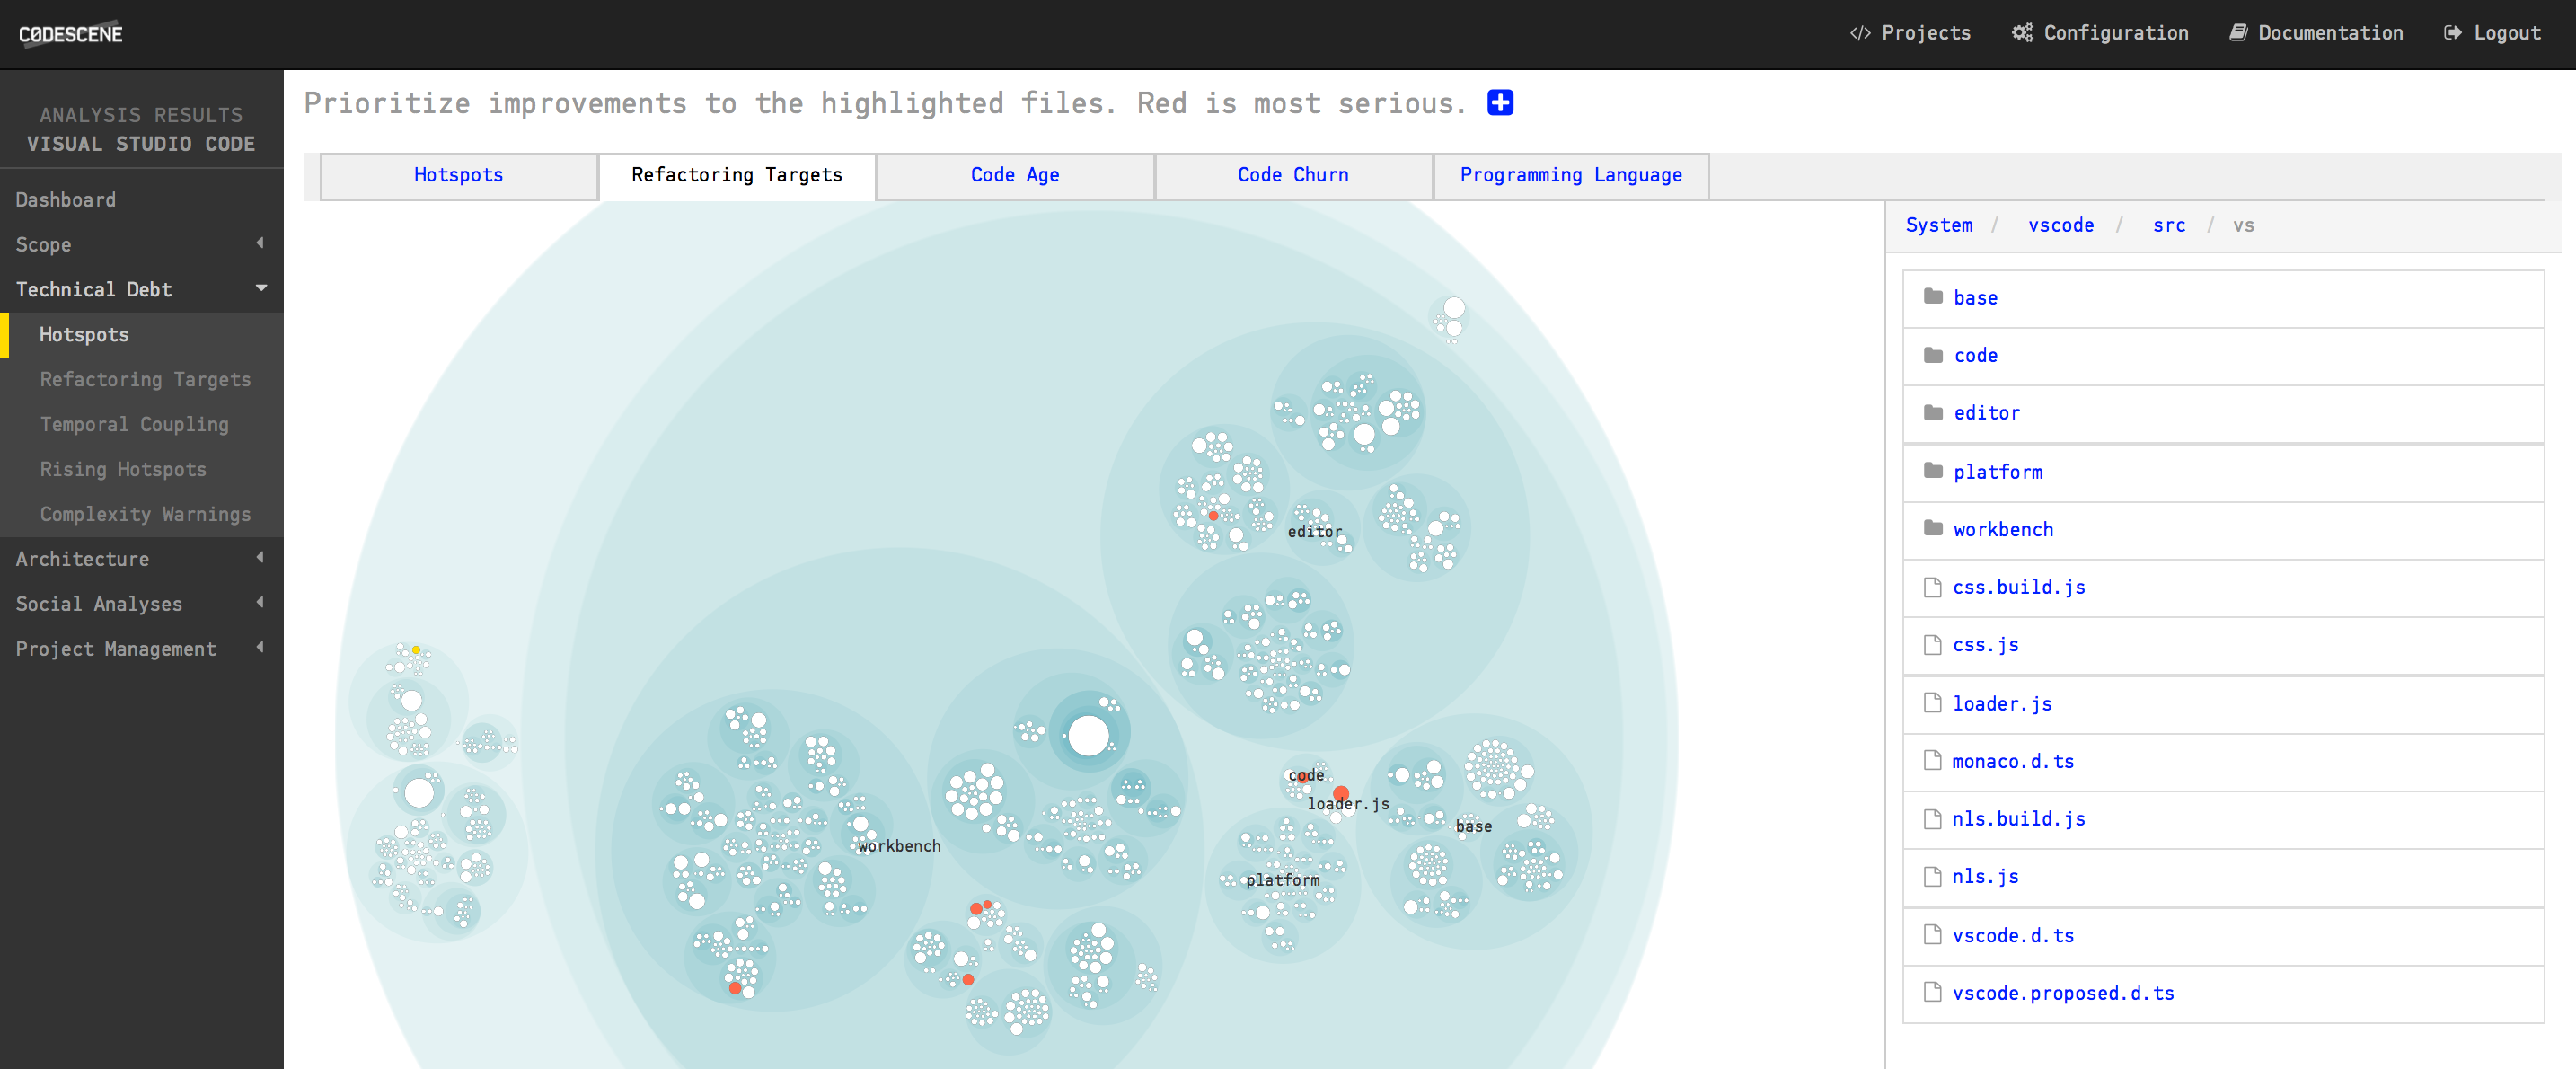
Fig. 18 CodeScene prioritizes the Hotspots in your code.
The red hotspots are the ones you want to focus on improving first. Improvements to those parts are likely to give you a large return on your investment.
Once you’ve addressed those hotspots, the yellow hotspots become interesting as well. A yellow hotspot is likely to be a real problem as well, albeit not as severe as the red category.
Finally, note that the prioritized Refactoring Targets are accessible as a plain list too in order to give you an overview, as shown in Fig. 19. This list is identical to the information highlighted in your hotspot visualization above.
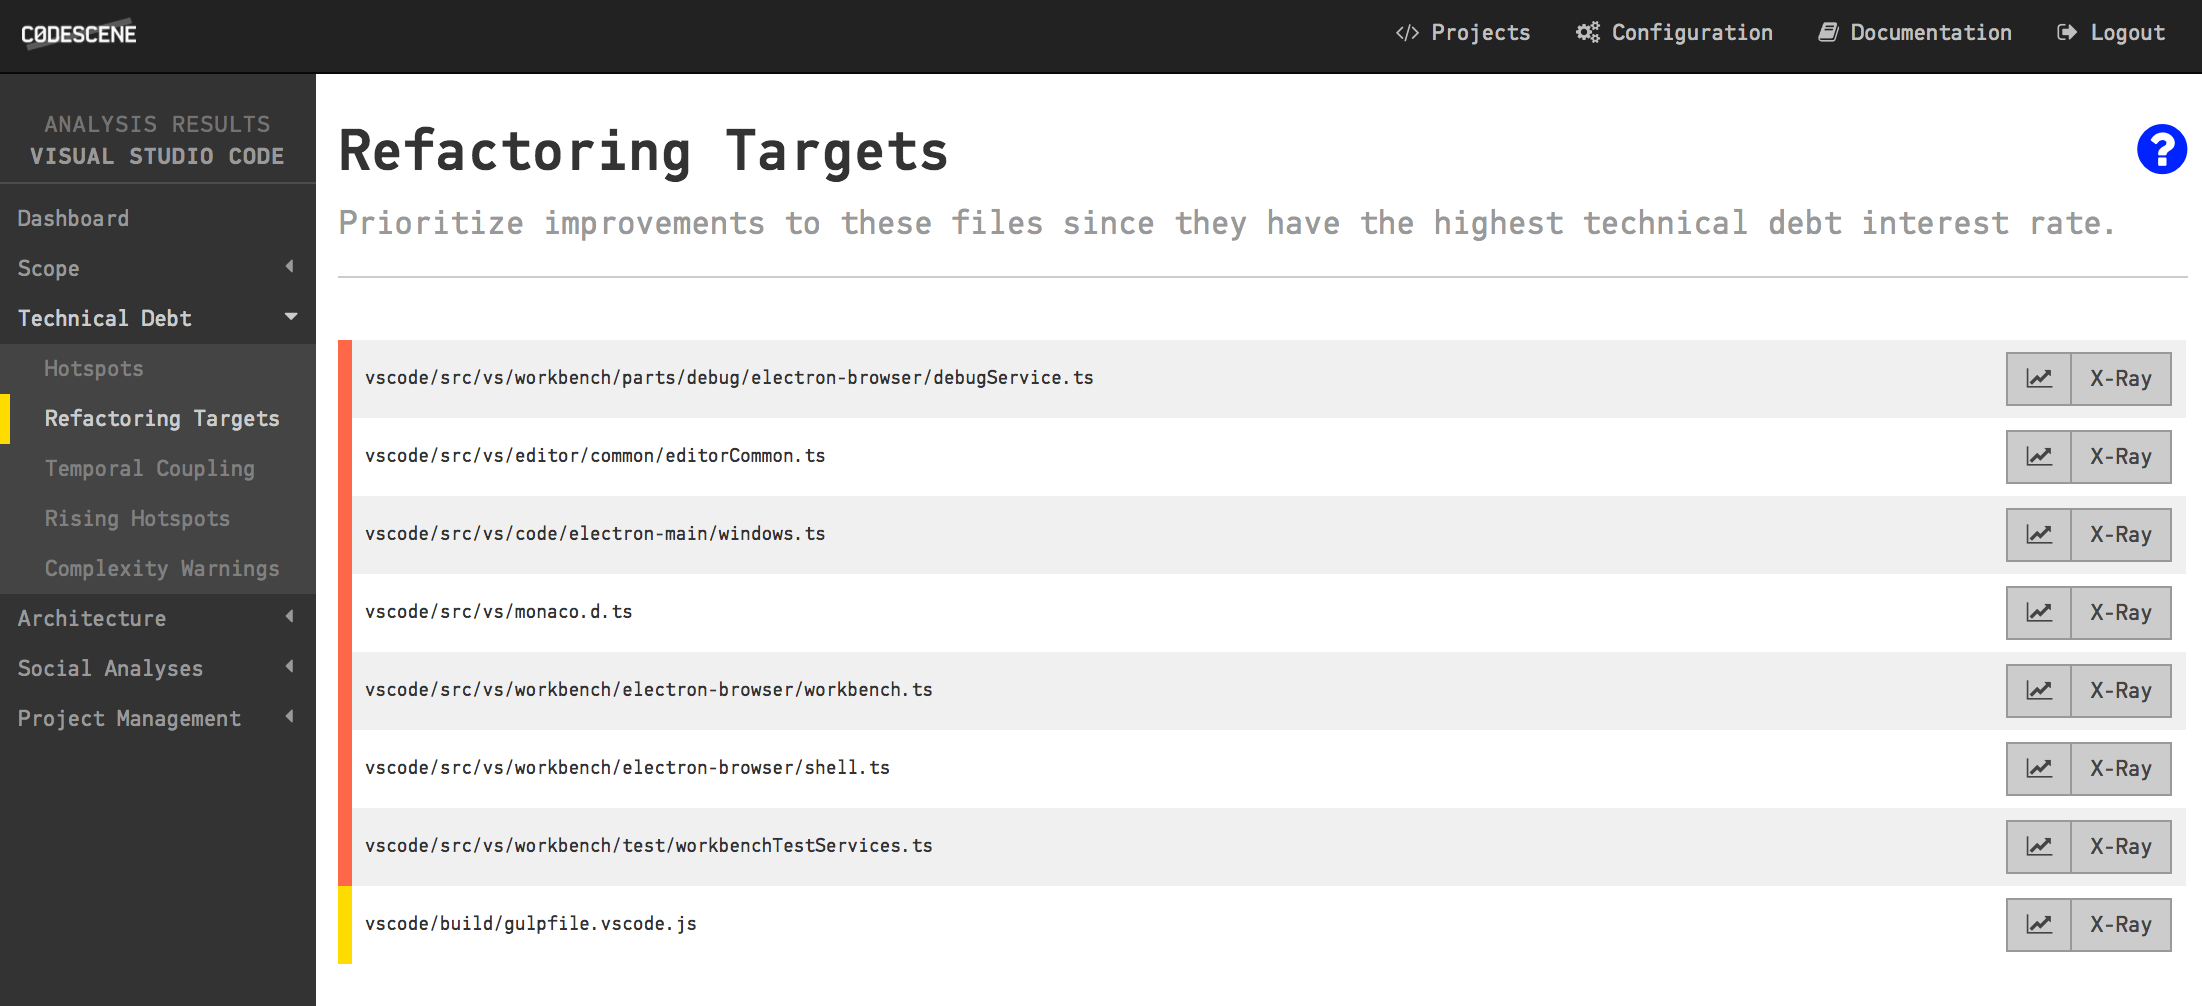
Fig. 19 View the list of your refactoring targets.
Shrink the Problem Space with Main Suspects
The ranked list presented as Refactoring Targets is based on probabilities; We cannot guarantee that the code represents a true problem, but it’s likely to be one. And, best of all, that data is based on how your developers have worked with the system so far.
The main advantage of using the Refactoring Targets as a guide to improvements is that you’re able to narrow down refactorings to a small part of the system. That in turn will give you more time to tackle larger issues once you’ve made these initial improvements.
Dive into your Hotspots
A large codebase may contain many different hotspots. You will also notice clusters of hotspots, which may indicate that a whole component or package is undergoing heavy changes.
The Hotspots Activity map in CodeScene lets you explore your whole codebase interactively as illustrated in Fig. 20.
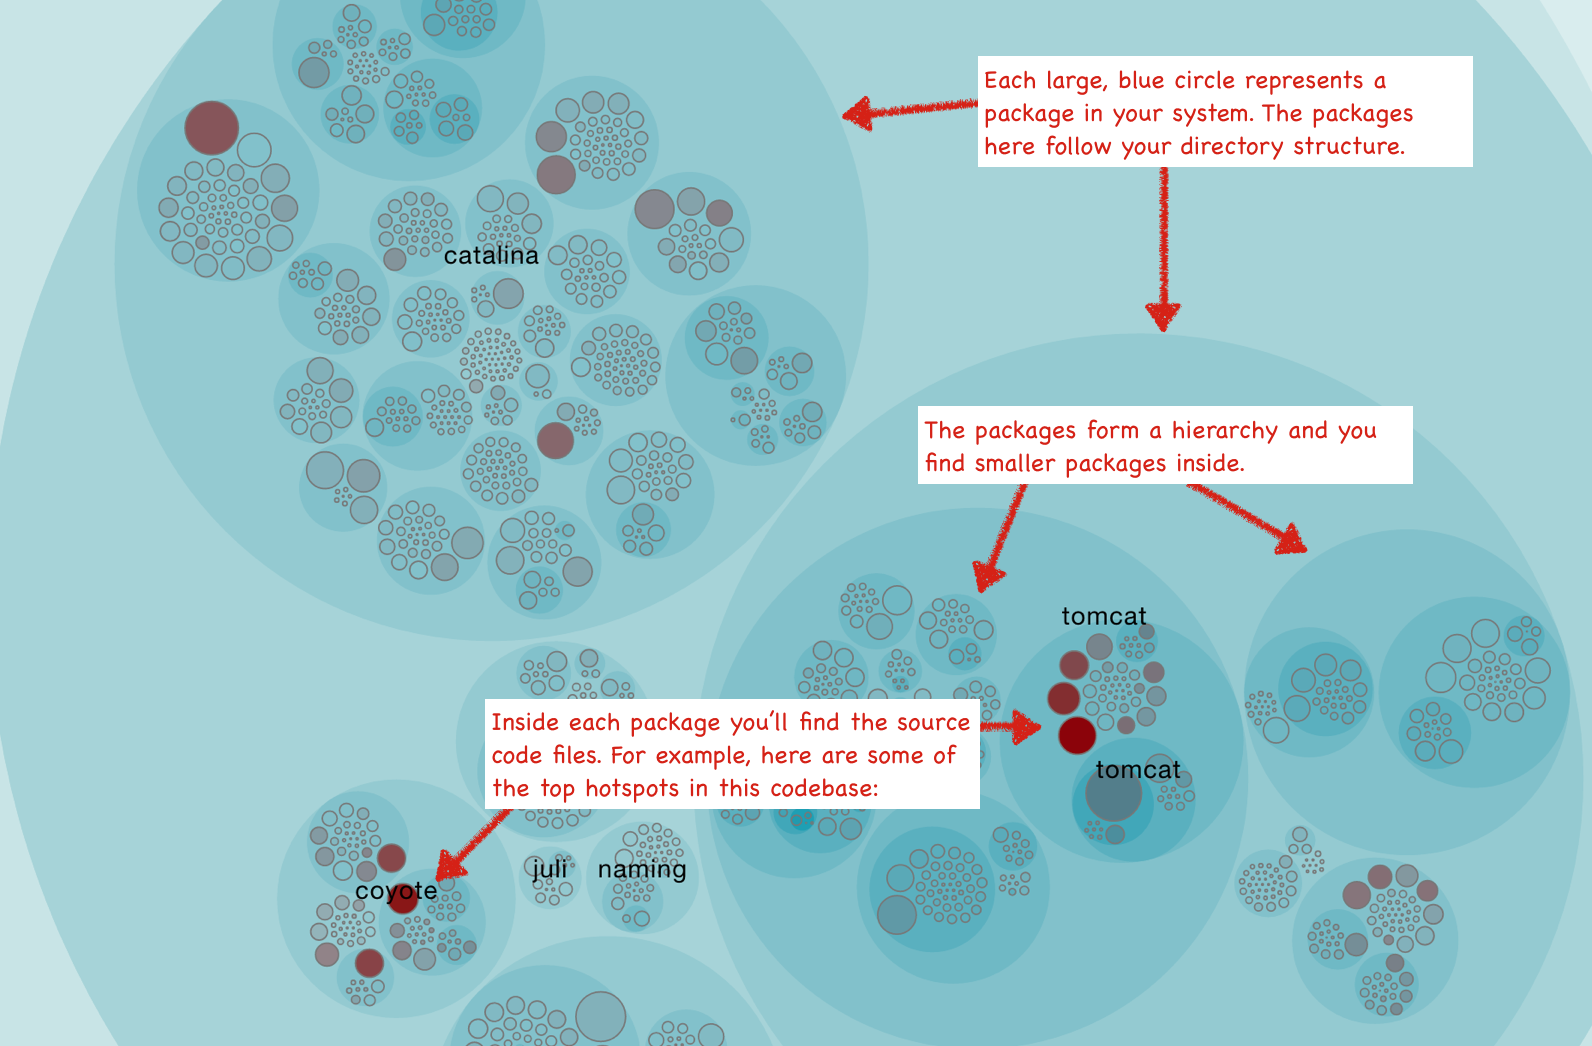
Fig. 20 Hotspots show you the activity in your codebase.
The hotspots map is interactive and hierarchical; Each large blue circle represents a folder in your codebase. That means you can zoom in and out to the level of detail you’re interested in:
- Click on one of the large, blue circles representing a directory to zoom in on its content.
- Click on a Hotspot to view information about it and to access its context menu to run detailed analyses.
- Click outside the circle representing a zoomed in folder to zoom out again.
- Hover the mouse over a circle to see information about the module it represents.
The most common interaction is to click on a Hotspot to get more details about it as illustrated in Fig. 21.
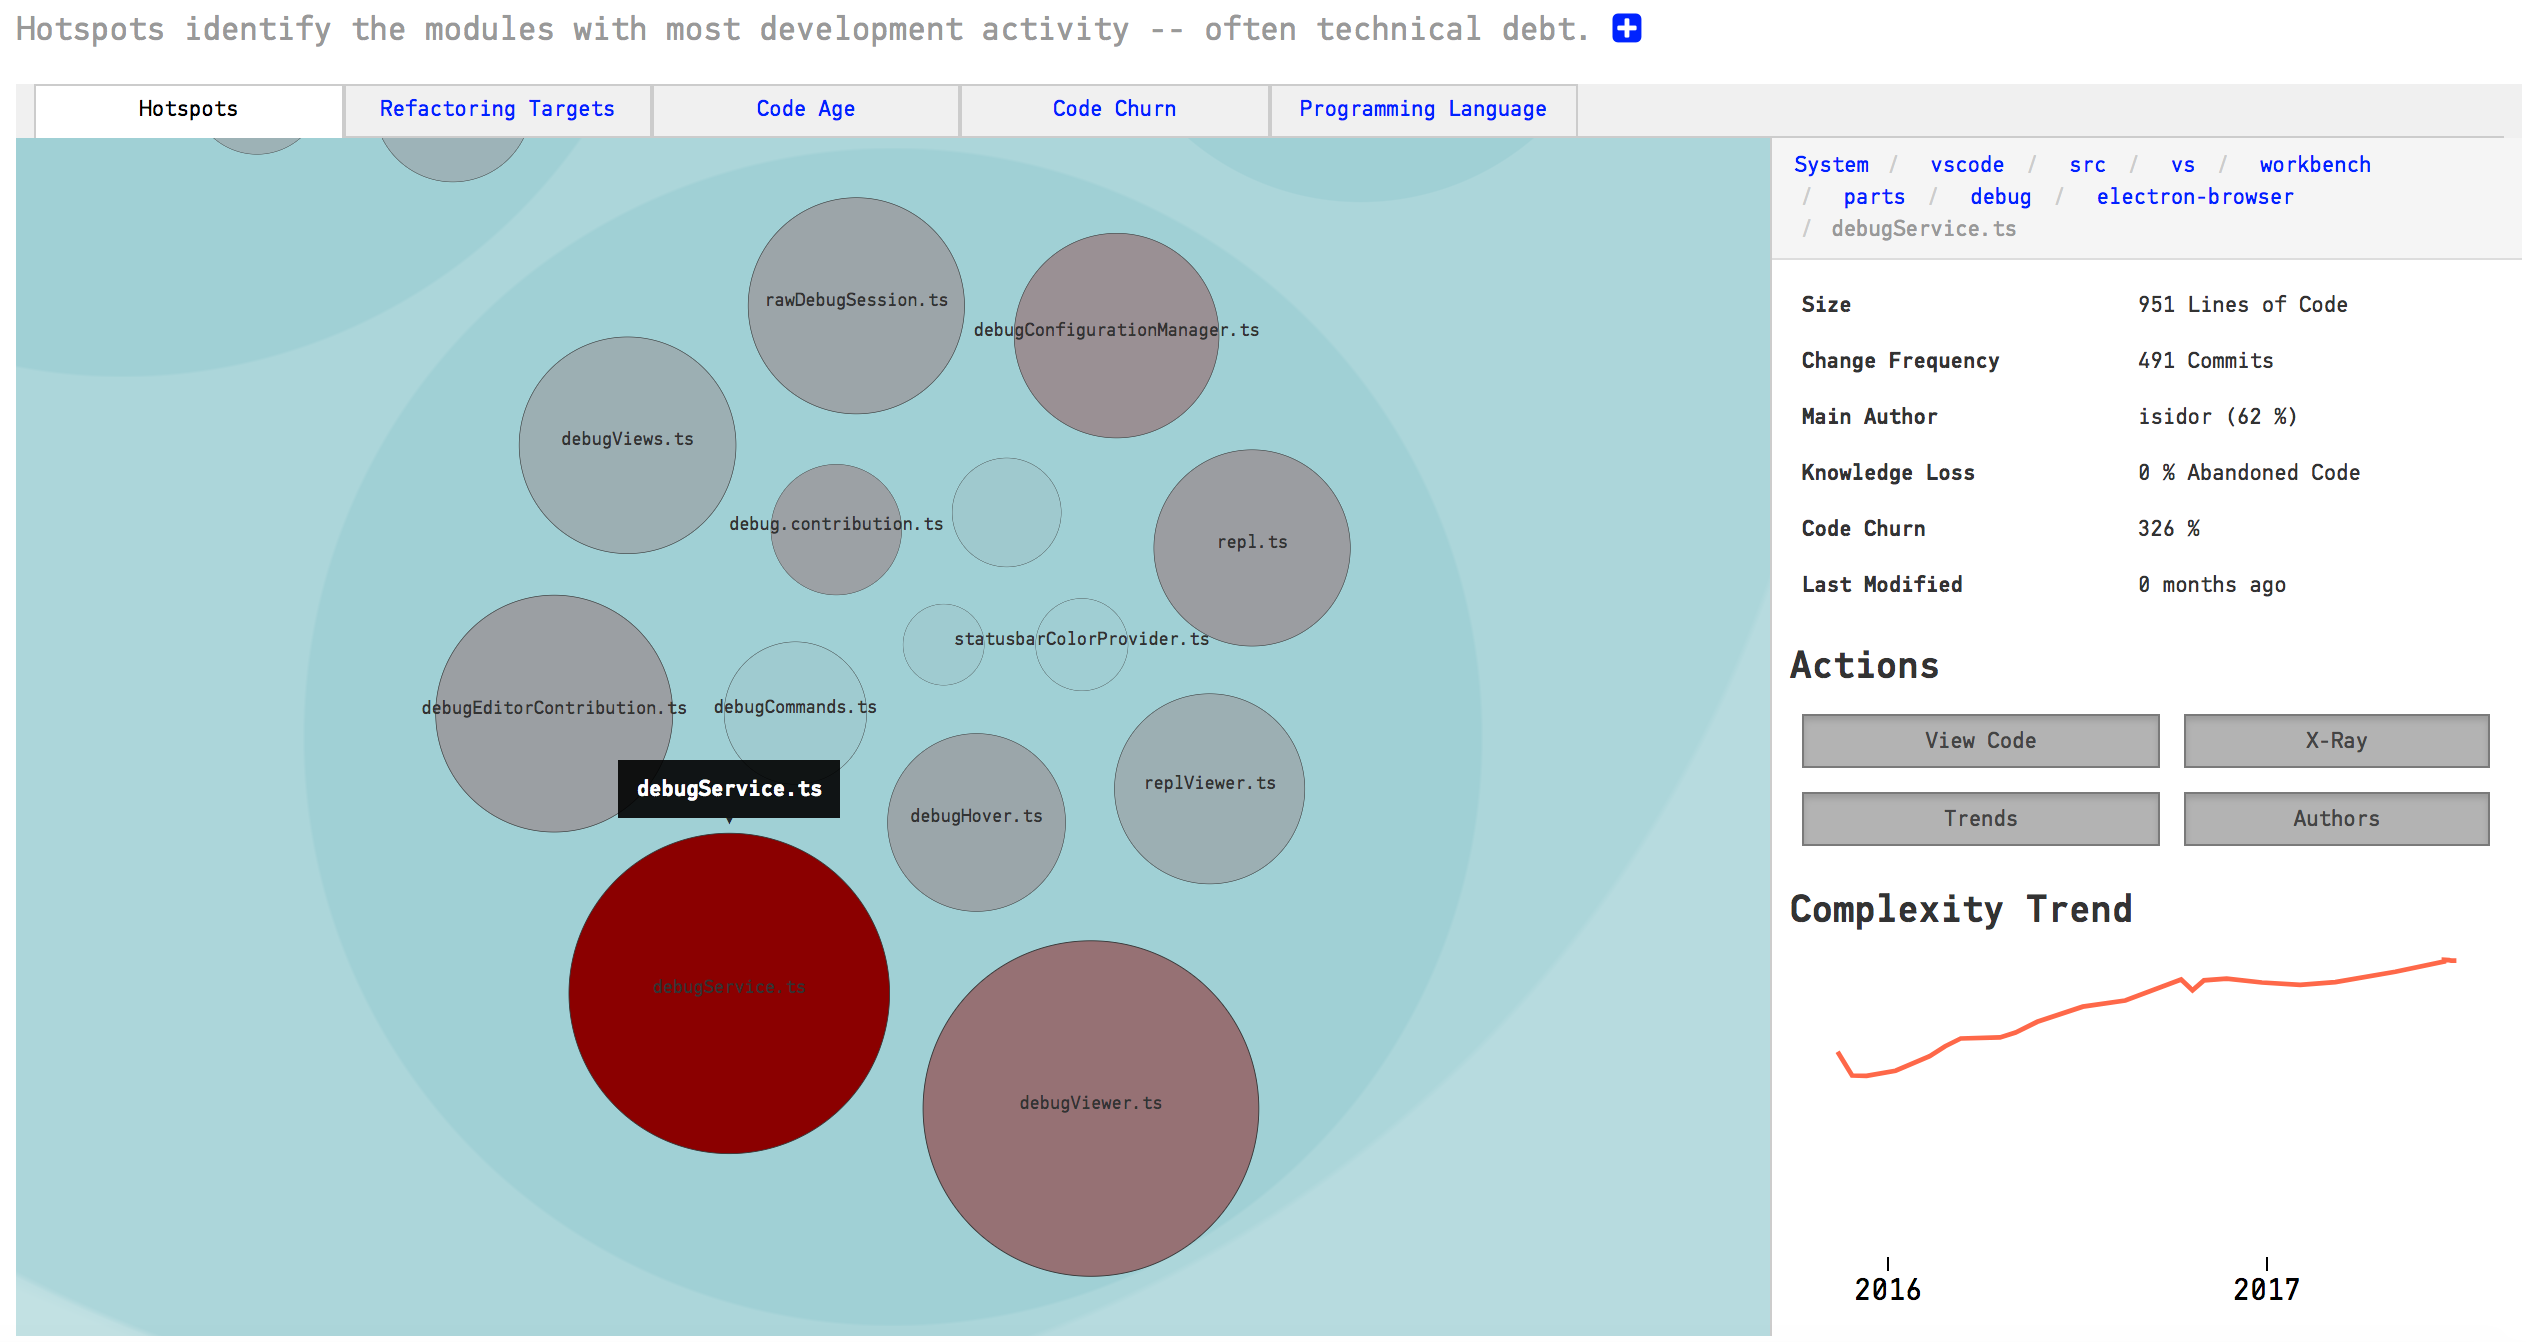
Fig. 21 Click on a Hotspot to access the context menu.
Use the context menu to access the code for inspection, run CodeScene’s X-Ray (see X-Ray), investigate trends (see Complexity Trends) and contributors (see Parallel Development and Code Fragmentation).
CodeScene’s hotspot view also lets you view different aspects of your system, as illustrated in Fig. 22.
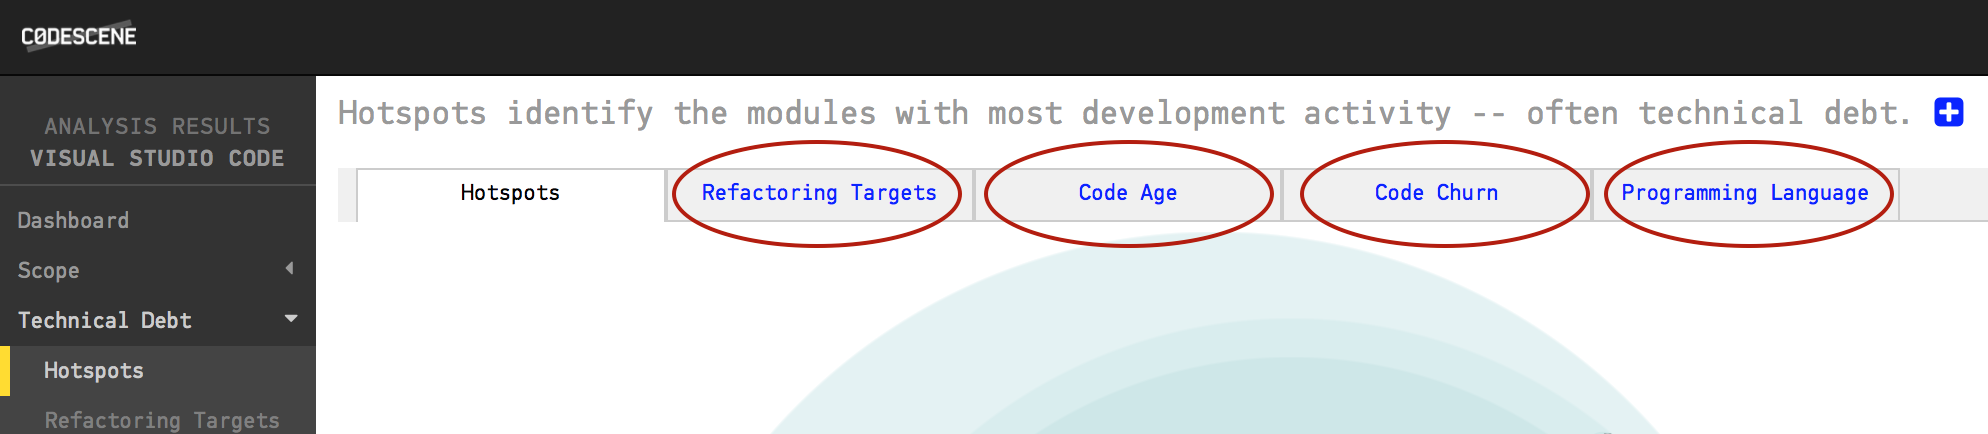
Fig. 22 Switch between different aspects in the hotspot view.
Just click on an aspect to view its data. For example, Fig. 23 shows the distribution of programming languages used in the implementation of a system.
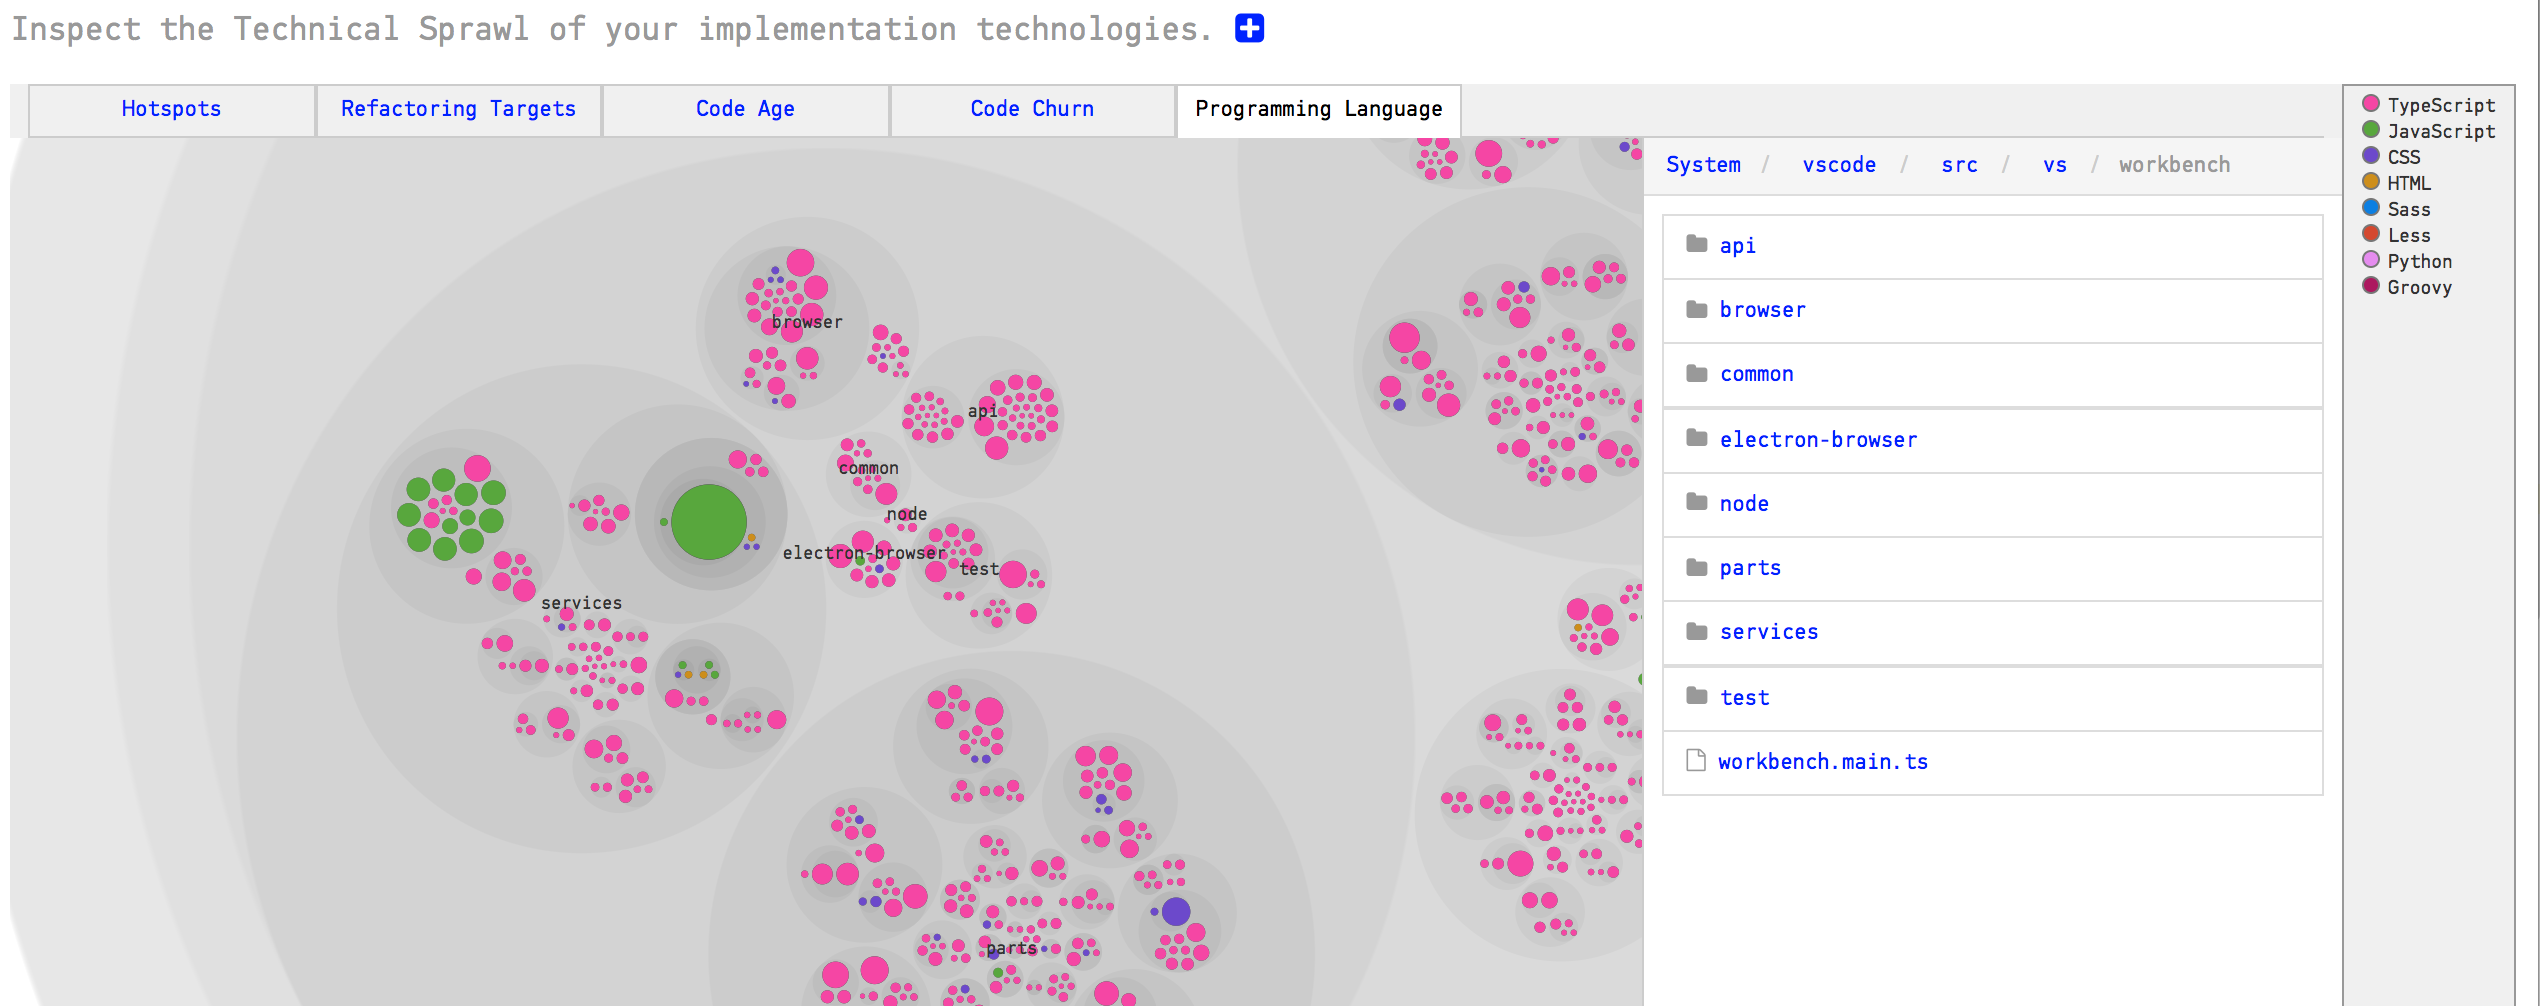
Fig. 23 The programming language aspect shows the technical sprawl in your codebase.
Use Code Churn as an Alternative Hotspot Metric
Another interesting aspect is Code Churn. By default, CodeScene uses the commit frequency of each file as the Hotspot criteria; The more changes you’ve done to a file, the higher its change frequency. This default criteria is supported by several findings from academic research; change alone is the single most important metric when it comes to quality issues in code. However, there are some rare cases when this metric becomes biased. One reason is large individual differences in commit style.
Relative Code Churn is an alternative hotspot metric that calculates the amount of change in each file in terms of Lines of Code. It’s a relative metric since the churn is weighted against the total size of the code in each file.
Let’s look at some use cases now that you know how the Hotspots analysis works.
Know how to use Hotspots
A Hotspot Map has several use cases and also serves multiple audiences like developers and testers:
- Developers use hotspots to identify maintenance problems. Complicated code that we have to work with often is no fun. The hotspots give you information on where those parts are. Use that information to prioritize re-designs.
- Hotspots points to code review candidates. At Empear we’re big fans of code reviews. Code reviews are also an expensive and manual process so we want to make sure it’s time well invested. In this case, use the hotspots map to identify your code review candidates.
- Hotspots are input to exploratory tests. A Hotspot Map is an excellent way for a skilled tester to identify parts of the codebase that seem unstable with lots of development activity. Use that information to select your starting points and focus areas for exploratory tests.
Use Hotspots in your Daily Work
How well does Hotspots work in practice? Well, it turns out there’s strong scientific support behind the metric. The research has often focused on bug predictions, which is relevant since bugs are one of the main issues behind expensive software maintenance.
The book “Your Code as a Crime Scene” (Tornhill, 2015) dives deeper into those research findings to explain why and how Hotspots work. But let’s just summarize the conclusions in one line: There’s a strong correlation between Hotspots, maintenance costs and software defects. Hotspots are an excellent starting point if you want to find your productivity bottlenecks in code.
That means you want to take your Hotspots seriously. Our recommendation is to run a Hotspot analysis at least once a week. It’s also a good idea to share your findings with your team. Why not gather everyone around a Hotspot Map every now and then?