Knowledge Distribution
Let’s face it - software development is a social activity. We work in teams, sometimes distributed, where we need to communicate and coordinate in order to solve our tasks. Building an organization responsible for creating and evolving a system is a necessity as soon as your codebase has grown beyond a certain size. It’s our way to scale and be able to take on larger problems than what we could as individuals.
But moving from individual developers to teams does not come free; No matter how efficient we, as an organization, are, we’ll always pay a price. The cost of team work is known as process loss. Process loss is the theory that a team, just like a mechanical machine, cannot operate at 100 percent efficiency. In the mechanical world we have inefficiencies like friction and heat loss. Our software equivalents are coordination and communication. The main challenge in most software projects is to minimize the process loss. Failures to do so often come off as technical issues, when in reality those issues have social roots.
The software industry has been aware of these issues. But until now, we’ve never had a way to measure them. This is about to change. In this guide you’ll learn how CodeScene helps you uncover knowledge distribution and identify team productivity bottlenecks in your system. With the following suite of analyses you’re now able to make organizational decisions based on data from how you’ve actually worked so far.
How Do We Measure Knowledge?
The knowledge metrics are based on the amount of code each developer has contributed. CodeScene looks at the deep history of each file to calculate contributions. This makes sense for two different reasons:
- The last snapshot of a source code file wouldn’t be good enough since such shallow ownership is sensible to superficial changes (e.g. re-formatting issues, automated renaming of variables, etc).
- Even if one developer completely rewrites a piece of code, its original author will still retain some knowledge in that area since they’re familiar with the problem domain. The metrics in CodeScene acknowledge that and will retain some knowledge for the original developer as well.
CodeScene uses the name of each committer to calculate knowledge metrics. So please make sure you understand the possible biases discussed in Know the possible Biases in the Data.
Prepare the Analyses by Assigning Colors to Developers and Teams
Your knowledge maps are based on colors to give you an accessible high-level overview. Please refer to the guide in Configure Developers and Teams to prepare for the knowledge analyses.
Tip: Use the Code Churn by Author analysis results to identify the top contributors so that you can assign them as distinct colors as possible.
Explore the Individual Knowledge Map
The first knowledge analysis measures the knowledge distribution for individual developers in your codebase.
Each developer is assigned a color in the following visualization. The color of each file represents its main developer (that is, the developer who has contributed most of the code). You see the resulting visualization in Fig. 51.
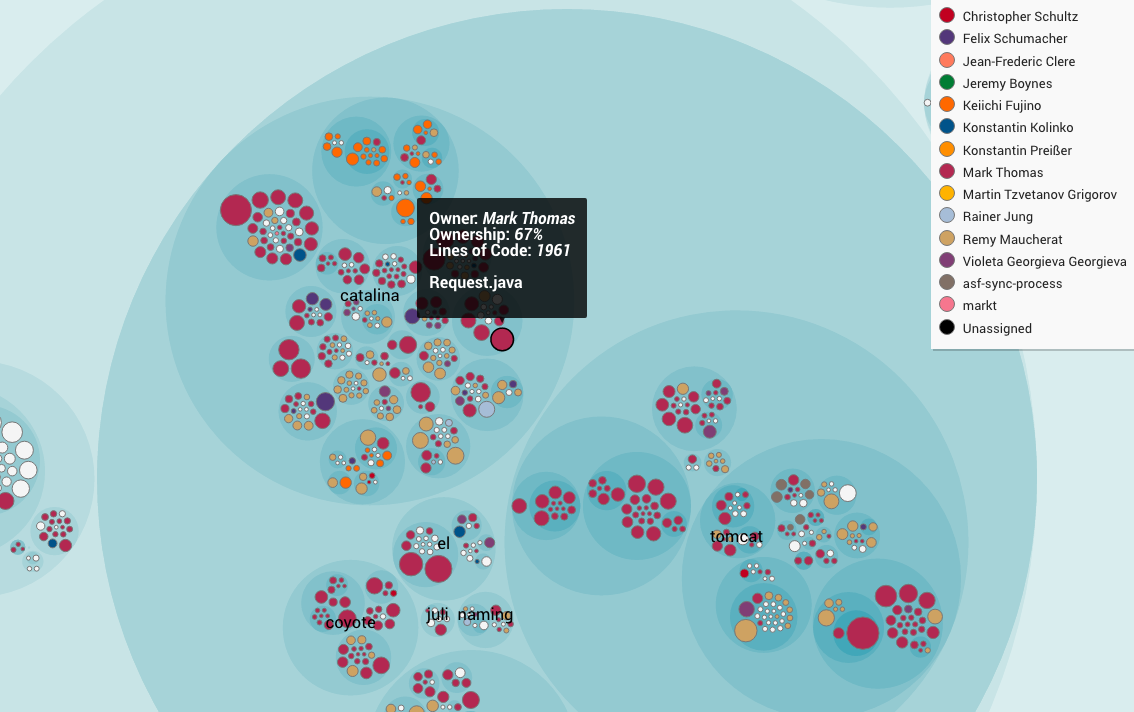
Fig. 51 An example of a knowledge map, hovering a circle to get more information.
All knowledge maps are interactive:
- Click on a circle to zoom in on the corresponding package.
- Click outside the circle to zoom out.
- Hover the mouse over a circle to see information about the package or file it represents.
Get more Detailed Information with Fractal Figures
If you look at the knowledge map in Fig. 51, you see that the
developer Mark Thomas has contributed 67% of the file Request.java. Who
are the other developers? What are their relative contributions? The Parallel
Development view with its Fragmentation Analysis (see
Fig. 52) answers that question.
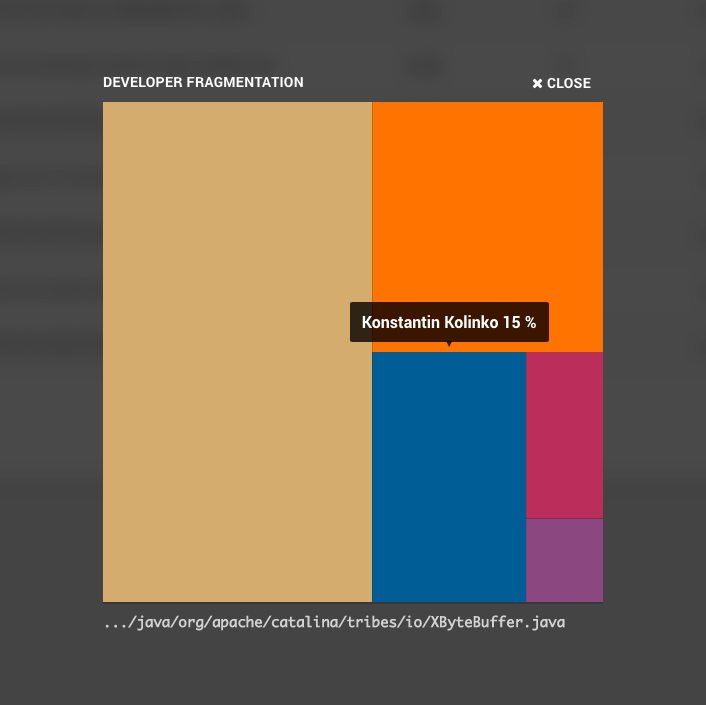
Fig. 52 An example of a developer fragmentation. Hovering a colored fragment shows the developer and the relative contribution.
Understand Development Fragmentation
The Fragmentation Analysis has more use cases. You use it to identify modules that suffer from excess parallel development.
Excess parallel development means the modules have a high fragmentation value. A high fragmentation value means that the development effort is shared between multiple programmers. This is a risk you want to be aware off - the number of programmers is one of the best predictors of the number of post-release defects in a module. The more programmers, the more quality issues in that code.
You use the fragmentation table to identify the most fragmented modules:
- Fragmentation 0 (zero): This means that the file has had a single developer working on it.
- Fragmentation closer to 1.0 (one): The closer to 1.0 the fragmentation gets, the more developers behind the code and the smaller the contribution of each developer.
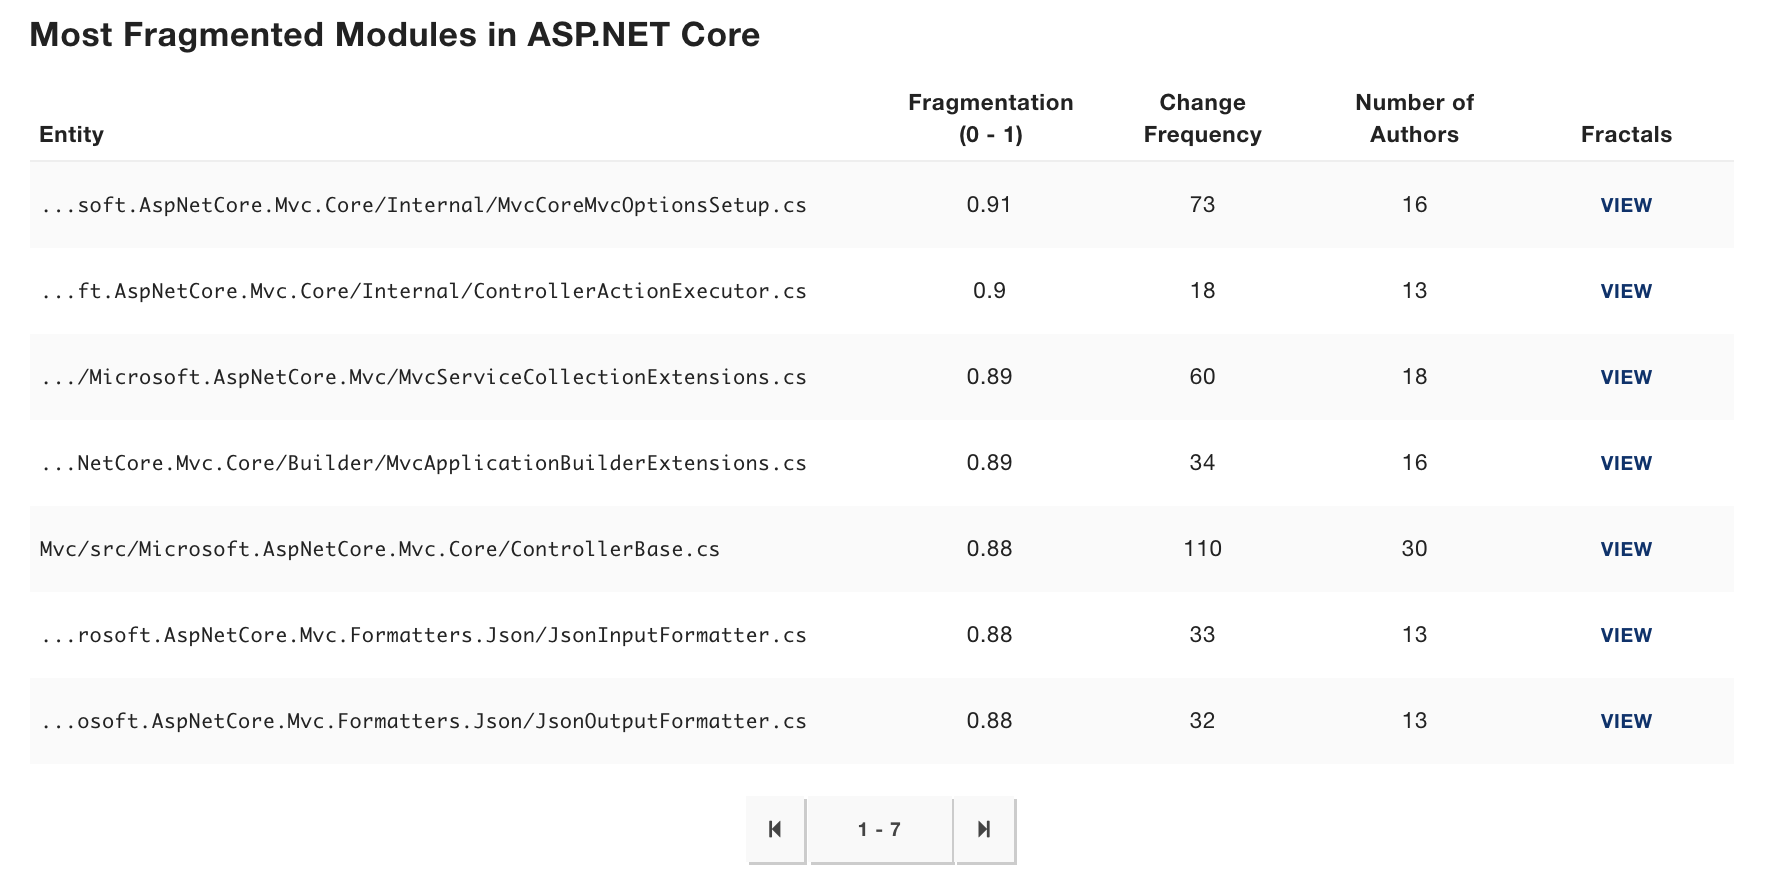
Fig. 53 An example of a fragmentation table.
The fragmentation table in Fig. 53 is sorted on the files with the most fragmentation. Please inspect your fragmentation data and make sure you investigate the findings.
Explore your Team Knowledge Maps
CodeScene also measures knowledge distribution on a team level and this information is usually even more valuable than the individual metrics.
As soon as you’ve assigned developers to a team, as described in Configure Developers and Teams, CodeScene will accumulate their individual knowledge into their teams. The analysis results are presented using the same principles as for the Individual Knowledge Map. Only now, each color represents a team.
The Team Knowledge Map lets you reason about both the responsibilities of the different teams. In general, you want to ensure that your team organization is reflected in the software architecture of your system. Please refer to the discussions in the guide Social Networks for more information on the organizational theories and how they correlate to the quality and efficiency of your organization.
Uncover the Knowledge Loss in your Codebase
Knowledge loss represents code that is written by a developer who is no longer part of your organization or project. You use this information to reason about the knowledge distribution in your codebase and as part of your risk management since it is an increased risk to modify code we no longer understand. In addition, you can also use the analysis pro-actively to simulate the consequences, in terms of knowledge loss, of planned organizational changes.
The Knowledge Loss analysis will accumulate the contributions of all developers that you have marked as Ex-Developers in your configuration (see Configure Developers and Teams). Those parts of the codebase that are dominated by Ex-Developers are marked as red in the knowledge loss visualization. Fig. 54 shows an example from an organization where some core developers have left.
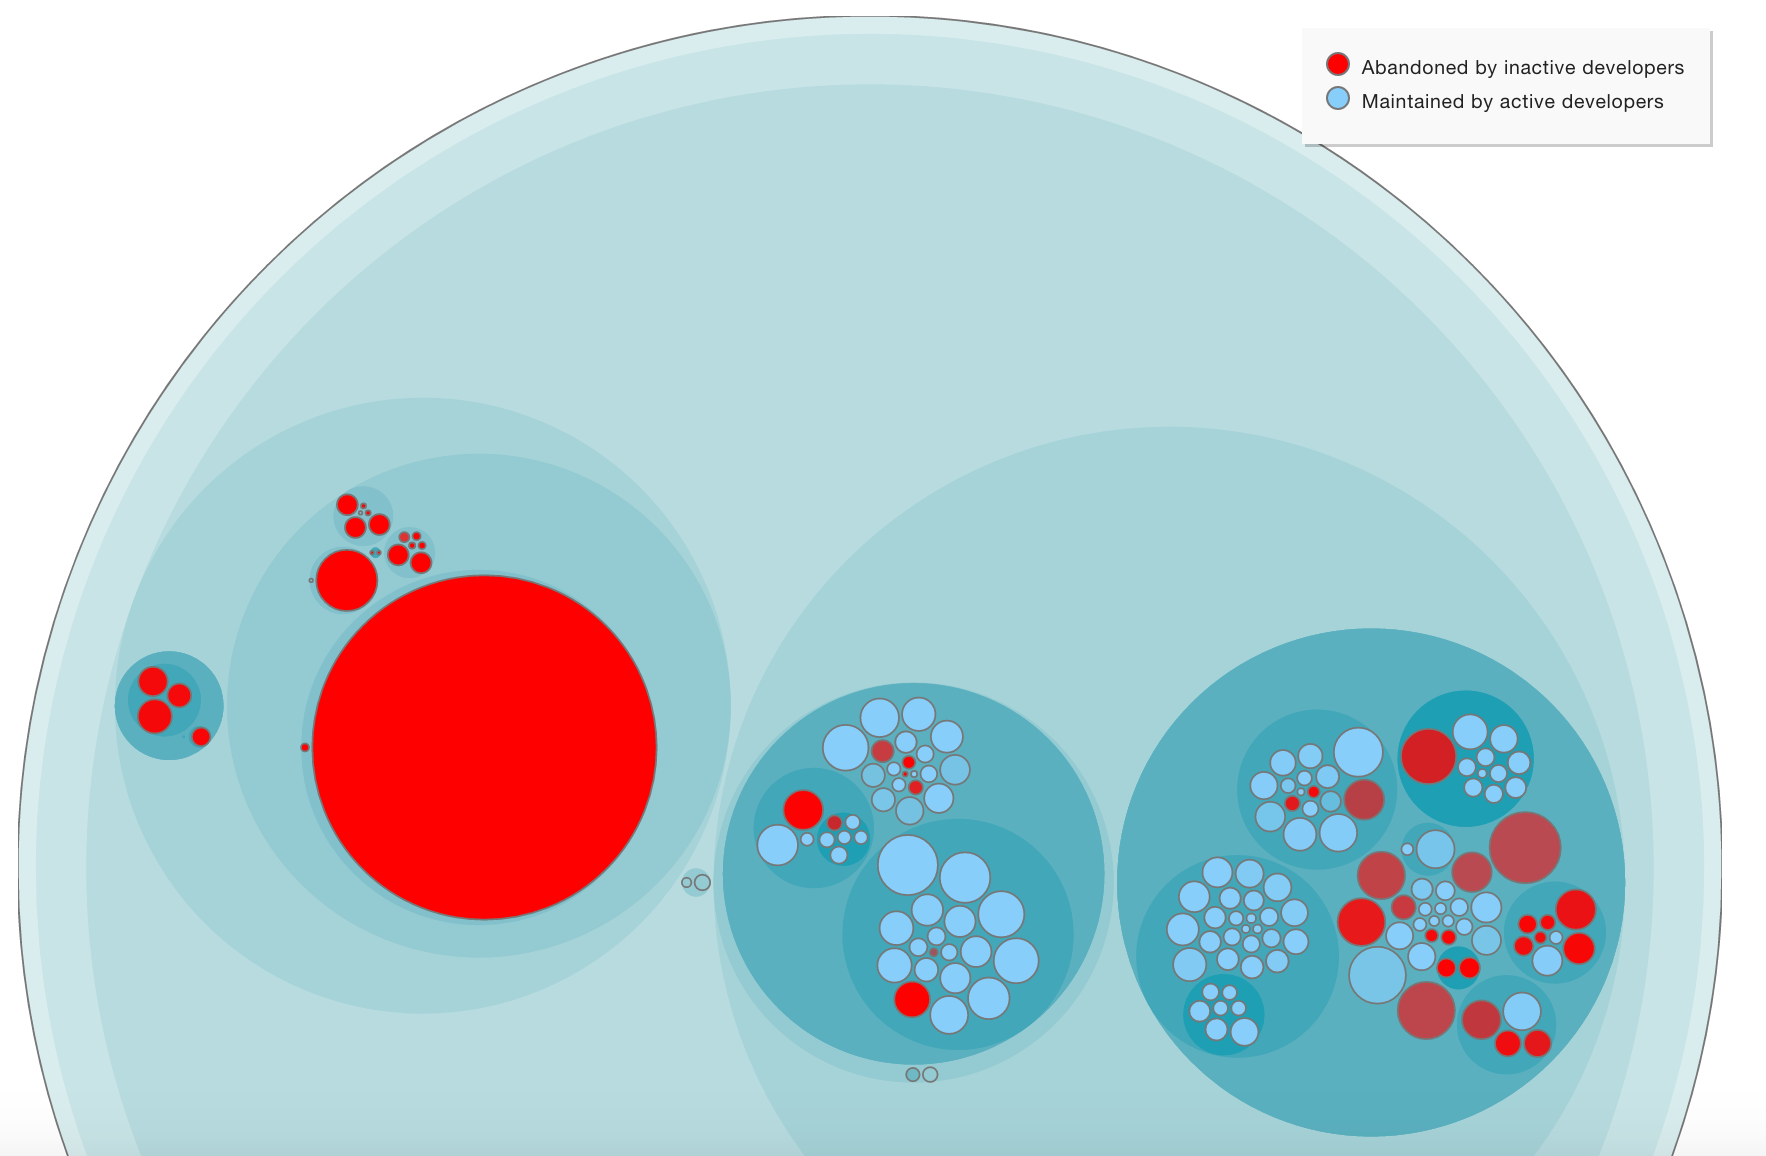
Fig. 54 An example on a knowledge loss analysis.
Know the possible Biases in the Data
Our social metrics, like all software metrics, are an approximation of the real world. There will always going to be corner cases and biases in the data. In particular, there are some situations where the metrics don’t perform as well. So please read the following section in order to minimize the bias in the analysis results.
Autosquash Commits
Some teams may use a Git feature called autosquash. This feature is a way of re-writing the development history. It may be fine if squashing is used for the work of an individual developer. Unfortunately the feature is sometimes used to combine the work of multiple programmers into a single commit.
The consequence is that the analyses lose important data for temporal coupling and, in particular, the social metrics become more limited than they’d have to be. For example, it’s not possible to generate a knowledge map over individual programmers, which means that you miss the opportunity to use the analysis methods for on- and off-boarding.
It’s highly recommended that you reconsider the autosquash strategy in case you apply it today. In general, the work of multiple programmers should not be compressed in a single commit.
Developers with Multiple Aliases
A developer may end up with multiple aliases. Perhaps they’re committing from both a personal- and a company account. Or they’ve changed their e-mail address. This introduces a bias in the data since CodeScene uses the name of each developer as their identification.
Fortunately, this bias is easy to avoid by utilizing a Git feature
called .mailmap. A .mailmap is a file that you include in the root of
your Git repository. The file specifies a mapping from multiple names and
addresses to the canonical name and address of each developer with multiple
aliases. It’s straightforward to use a .mailmap, so please check out the git
log documentation for the format.
Pair Programming
The knowledge metrics in CodeScene are based on the author of the code as recorded by Git. This may obviously be misleading if your organization does pair-programming.
A future version of CodeScene will address pair-programming knowledge by having the option to fetch the author names from the commit message instead and assign the knowledge to both authors. However, in the current version there’s no such option.
If you use pair-programming you’re also likely to rotate pairs on a daily basis. In that case, we recommend that you ignore the analysis of individual developers and focus on your team knowledge map instead, which will have accurate data.