X-Ray
X-Ray gives you Deep Insights into your Code
Hotspots are code with high change frequencies. We know that any improvements we do to a hotspot are likely to pay-off immediately. However, sometimes those improvements aren’t straightforward; Some of the worst hotspots we’ve seen are files with several thousands lines of code. Given that amount of code, where do we start? Are all parts of that file equally important? Are there any functions or methods that contribute more to the code being a hotspot than others?
Until recently, this is where the Empear tool suite stopped. After all, we’ve significantly reduced the amount of code we need to consider as we narrowed down a whole codebase to a single file where improvements matter. However, we need to do even better and Empear’s X-Ray fills this gap.
X-Ray is a language-dependent analysis. In the current version of the Empear tool suite, X-Ray is available for the following programming languages: C, C++, C#, Java, and Clojure. We’ll continue to add support for more languages over time.
An Overview of X-Ray
X-Ray is an analysis that operates on the function/method level of your code. Thus, X-Ray is able to provide deep and detailed information on what’s happening inside a Hotspot.
There are two main use cases for the X-Ray functionality:
- X-Ray lets you make sense of large files and get specific recommendations on the parts to improve.
- X-Ray provides detailed information on why a cluster of files are temporal coupled.
In the following guide we’ll cover both of these cases. Let’s start with how you can make sense of large files.
X-Ray calculates Hotspots on a Method Level
A Hotspot analysis is orthogonal to the data it operates on. That is, the Empear tool presents hotspots as individual files, but also on an architectural level as entire components and sub-systems. With X-Ray, we climb down the abstraction ladder and run a Hotspot analysis on a method level.
A large file is like a system in itself. Some parts remain stable, while other parts of the file keeping changing as new features are added and bugs get resolved. With X-Ray, you’ll get a prioritized list of the methods you want to refactor and improve first. This is important since re-designing a large module is both high-risk and expensive. So instead you want to take an iterative approach to your improvements and base those improvements on data.
To run X-Ray, go to your Hotspot map, click on the Hotspot and select ‘X-Ray’ from the context menu as shown in Fig. 22.
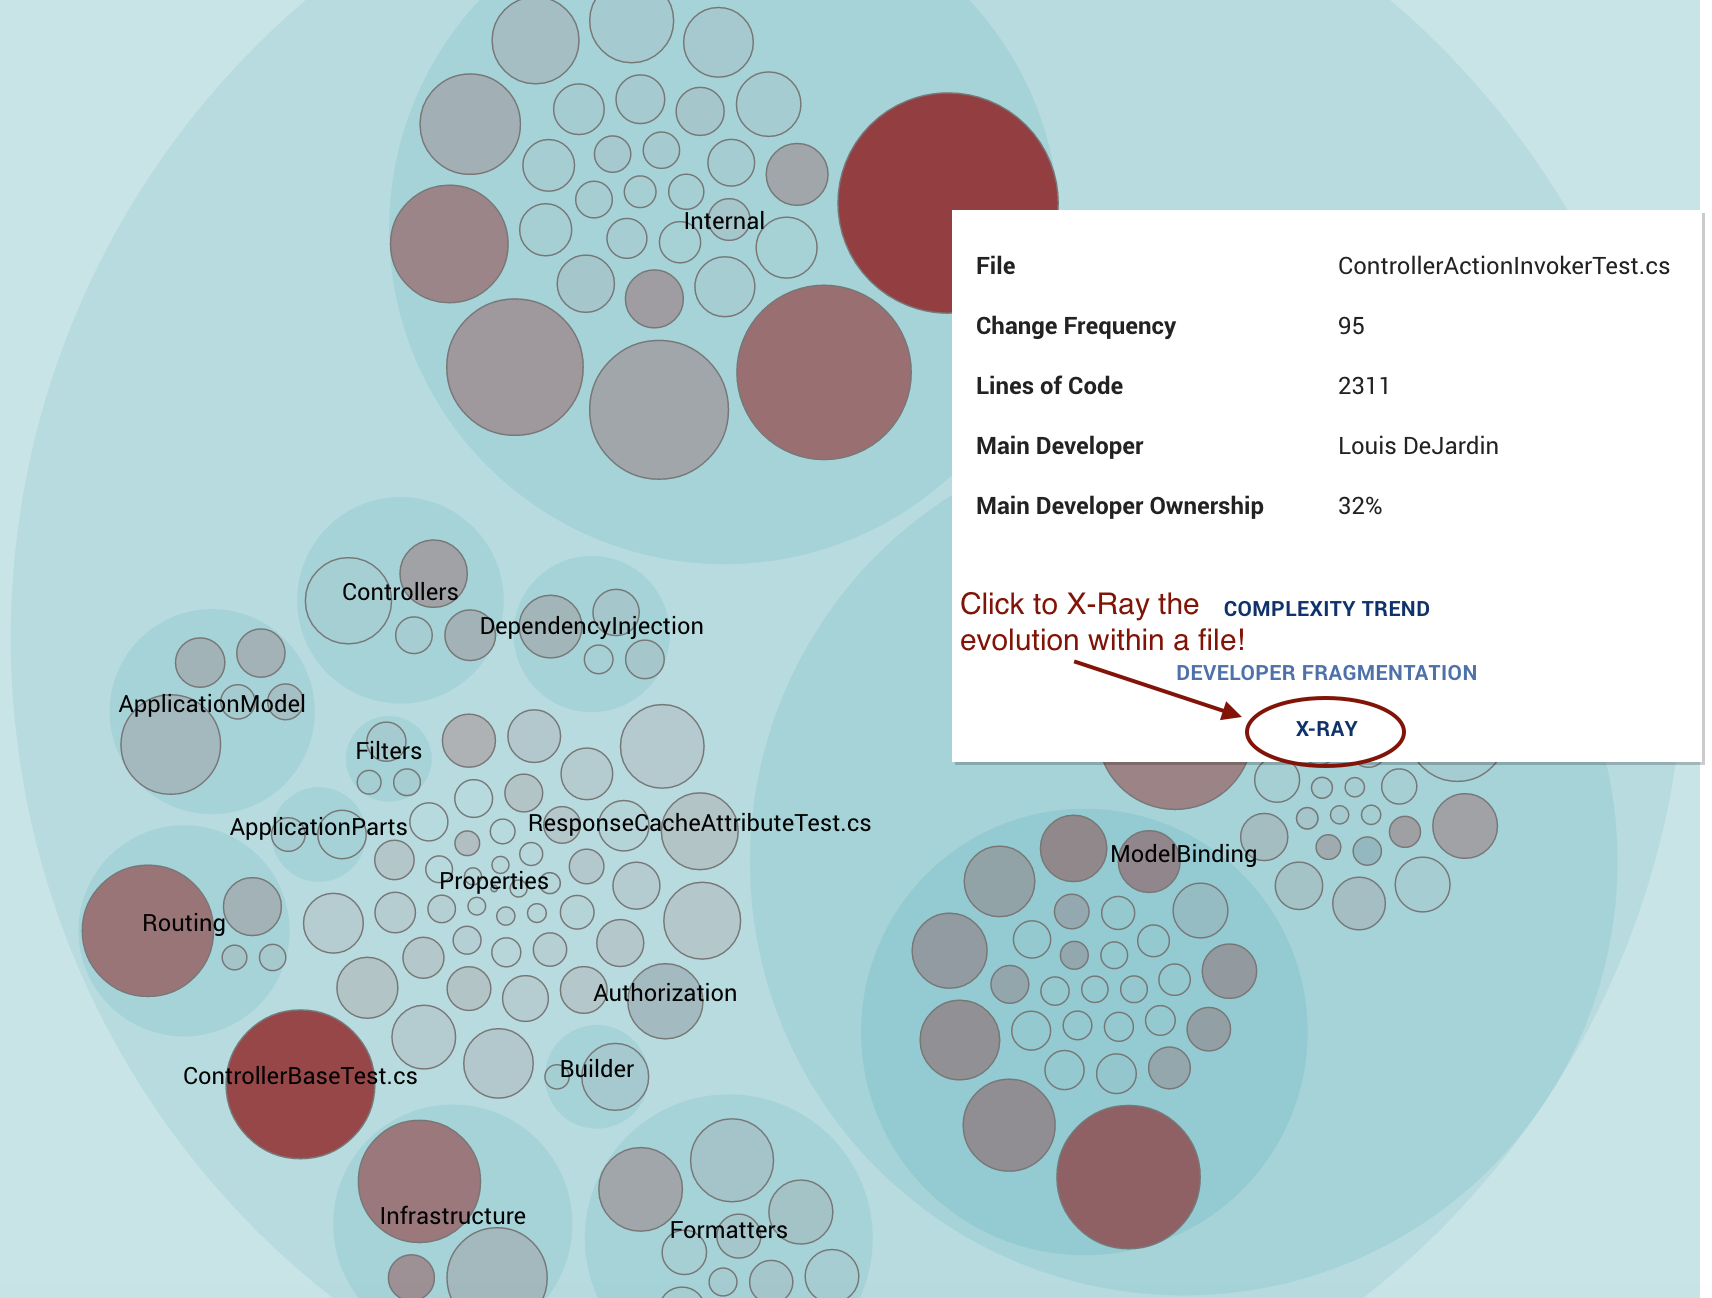
Fig. 22 Run X-Ray from the context menu.
X-Ray is run on demand. That is, the first time you execute it on a Hotspot it may take a few seconds to get the results. Sub-sequent accesses are cheap since we cache the results.
Once you get the results you’ll see that you typically spend more time on some methods than others. So let’s walk through the X-Ray results and look at the individual pieces. Have a look Fig. 23 as a starting-point.
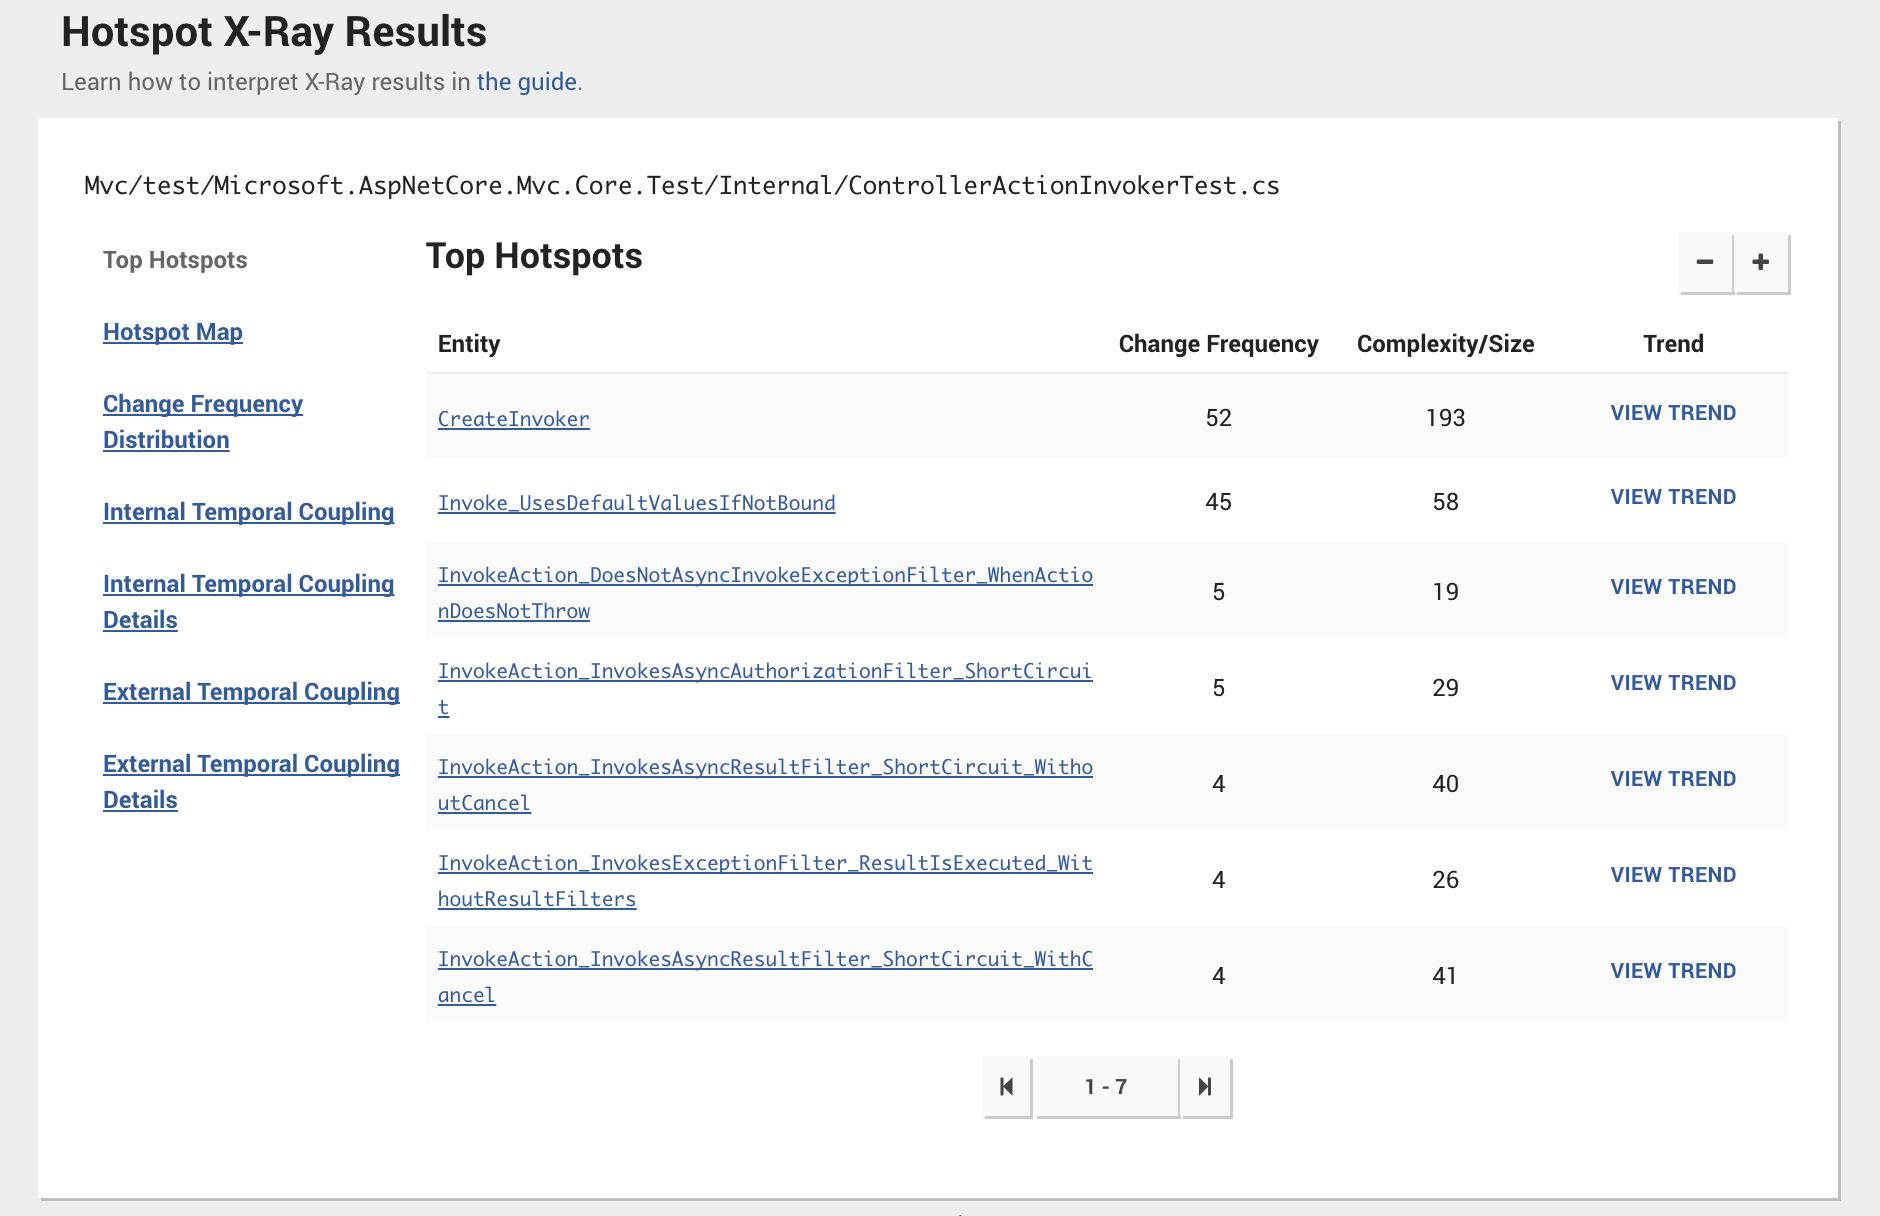
Fig. 23 The starting point in an X-Ray analysis.
Fig. 23 shows the results of an X-Ray analysis. We see that our hotspot is a method named CreateInvoker, which consists of 193 lines of code. This method is where you’d like to focus your refactoring efforts; The high change frequency of the method indicates that improvements are likely to pay-off immediately.
You also see that each row in the table above lets you run a Complexity Trend analysis. In this case, the trend analysis will show the complexity growth of an individual method. Look at the results of those trends to determine if the X-Ray hotspot represents a method that we’ve already started to refactor or, the more common case, represents code that continues to degrade in quality.
X-Ray calculates Temporal Coupling between Methods
As you X-Ray a Hotspot, Empear will also look for temporal coupling between individual methods. This is information that helps you identify unexpected change patterns. Let’s look the example in Fig. 24.
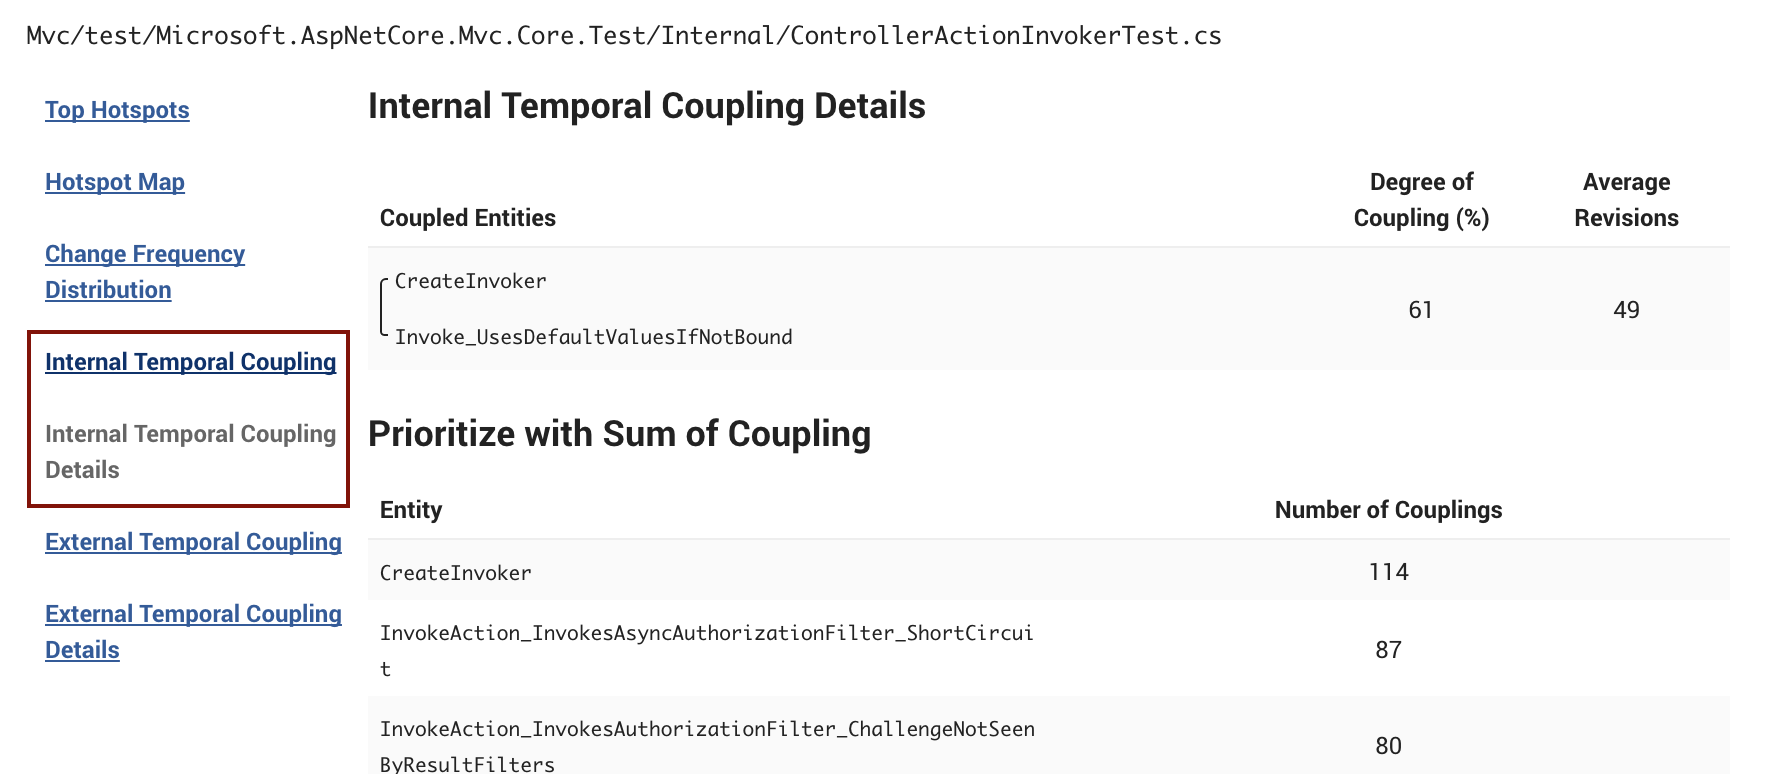
Fig. 24 X-Ray calculates temporal coupling between the methods in your Hotspot.
Fig. 24 shows that two methods, CreateInvoker and Invoke_UsesDefaultValuesIfNotBound changes together in 61% of all changes. That is, every second time you change one of these methods there’s a predictable change to the other one.
You use the Temporal Coupling results as input to your refactoring efforts. For example, in the example above, you probably want to have a close look at both methods to see why they are so strongly coupled in time. Often, there’s either a leaky abstraction or a fair chunk of duplicated logic in either part of the code.
X-Ray lets you look into Temporal Coupling Clusters
Temporal Coupling is one of the most powerful software analyses in our arsenal. A temporal coupling analysis often highlights unexpected change patterns in our codebase and provides us with important information that we cannot deduce from the code alone. However, temporal coupling has also been one of the hardest results to act upon.
Think about it for a minute. Let’s say that you investigate some temporal coupling results and identify a cluster of 10 files that tend to change together. Now, how do you uncover the reason for this coupling in time? Well, in more complex cases you need to compare the code and walk through the historic revisions to know which parts of the files that are responsible for the coupling. This can be painful, particularly for large files that are low on cohesion. Enter X-Ray for temporal coupling.
With X-Ray, all of these steps are completely automated. You just click on a file in the temporal coupling visualization and select ‘X-Ray’ from the context menu as illustrated in Fig. 25.
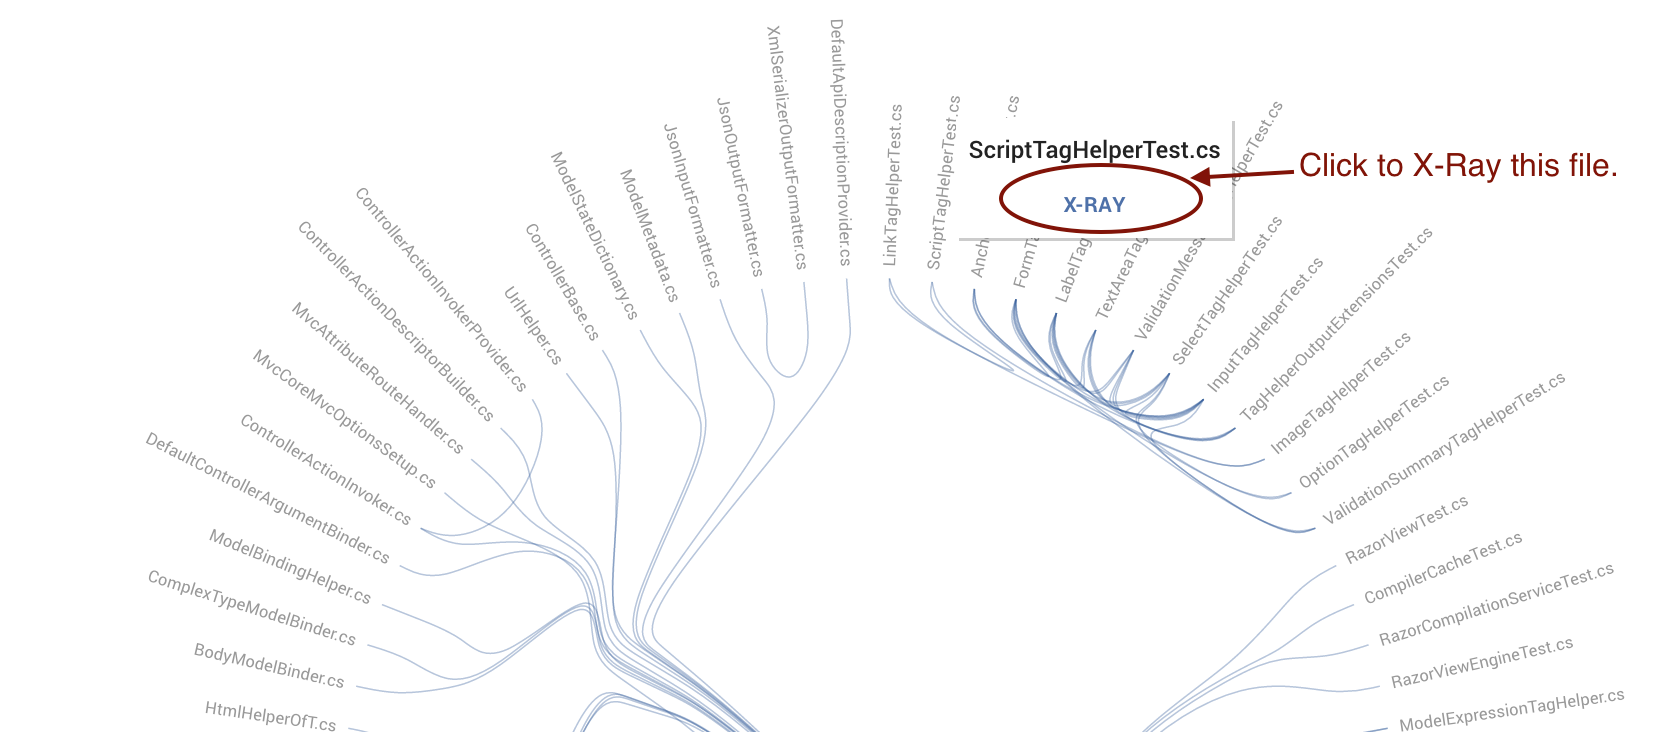
Fig. 25 X-Ray lets you investigate temporal coupling clusters in detail.
Once X-Ray is done, you’re presented with a dependency wheel on method level. Have a look the dependency wheel in Fig. 26 and I’ll walk you though the details.
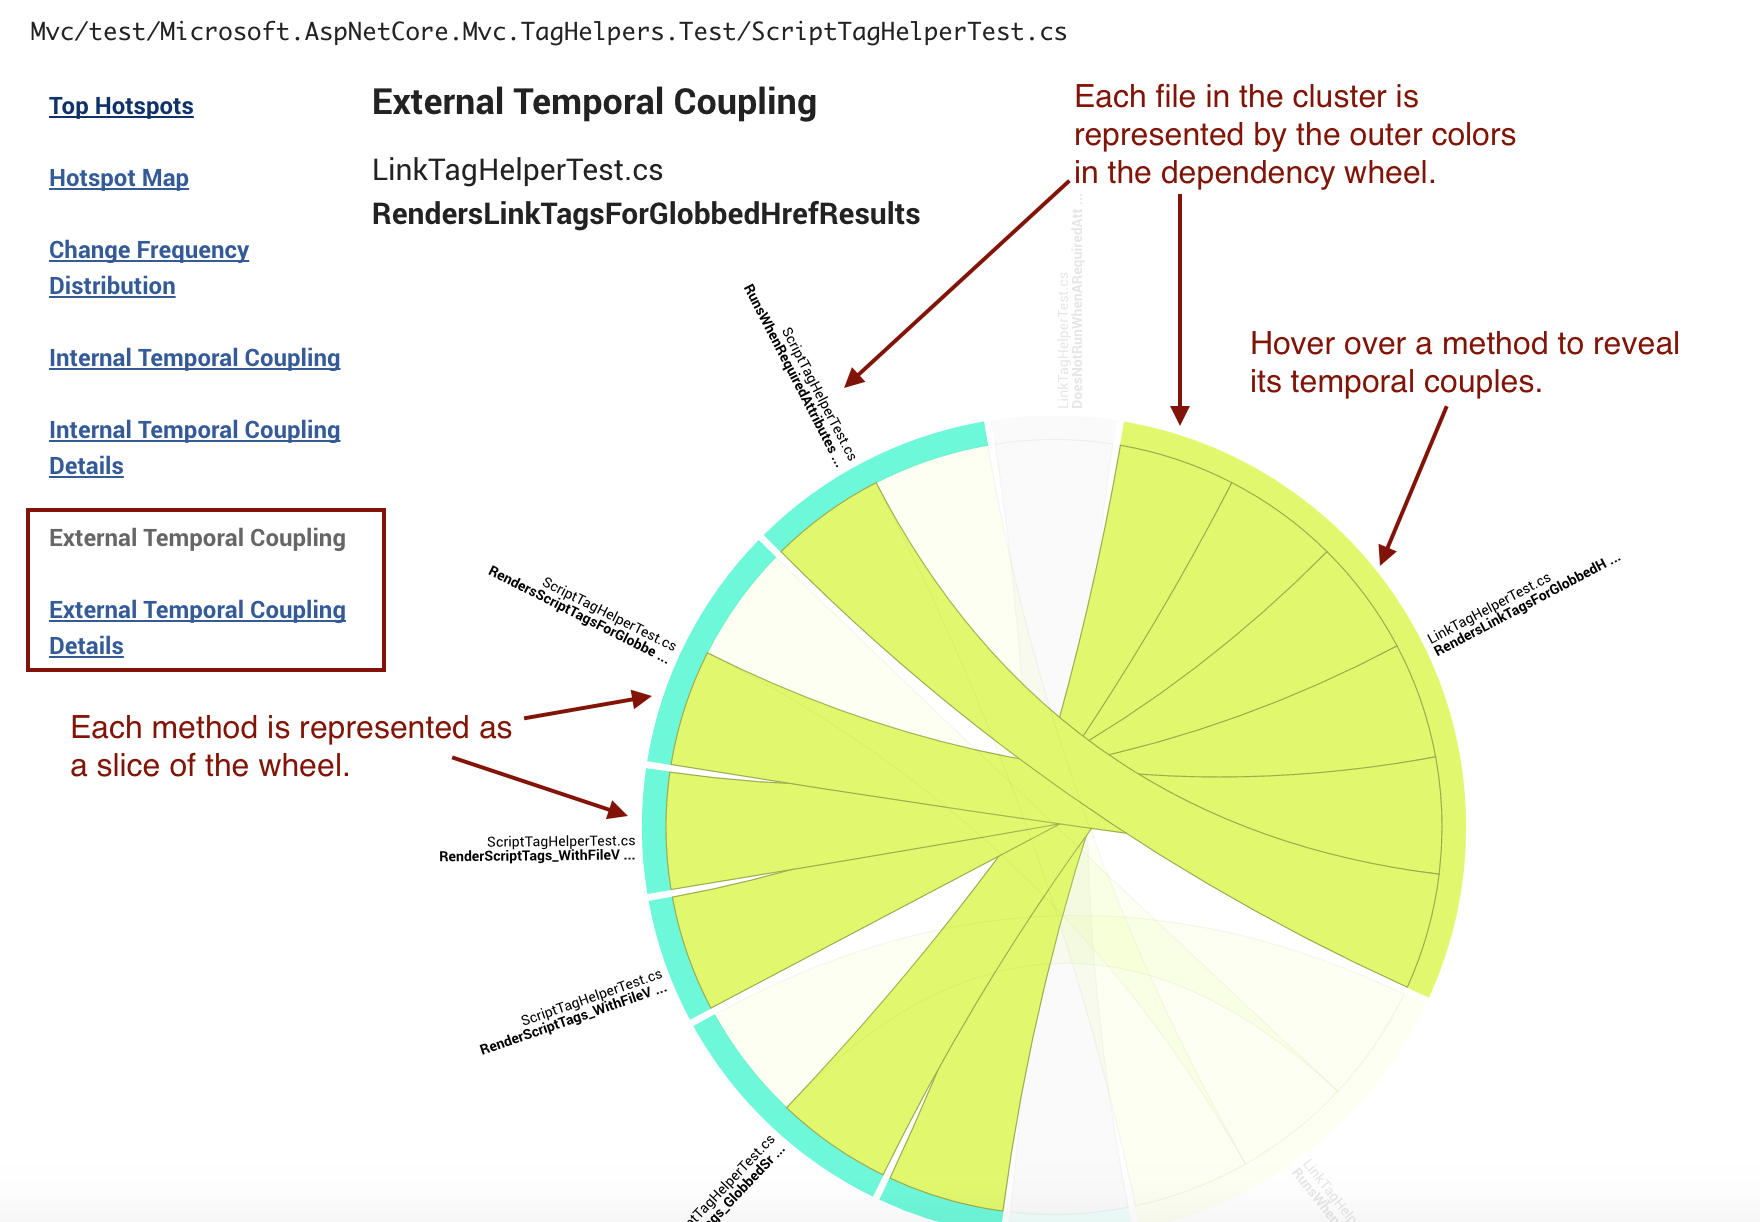
Fig. 26 The dependency wheel shows the temporal coupling between methods.
The dependency wheel in Fig. 26 is an interactive visualization. As you see in the example above, when we hover over the part that represents the method RendersLinkTagsForGlobbedHrefResults, we see that the method is coupled in time to six other methods located in a different class. This information is powerful: now we’ve limited the amount of code you need to inspect in order to improve the design and break this expensive change pattern.
X-Ray detects Software Clones
Temporal coupling arises for several reasons. It’s also important to note that all coupling isn’t bad. For example, you’d expect a unit test to change together with the code under test. However, in the case where you can’t think about any good reason two pieces of code keep changing at the same time you’ll inevitably find a refactoring opportunity.
One of the most common reasons for unexpected temporal coupling is a dear old friend: copy-paste. In fact, copy-paste is so common that we’ve included an analysis of code similarity in X-Ray.
You get to the code similarity analysis by clicking at the result tab for External Temporal Coupling Details as illustrated in Fig. 27.
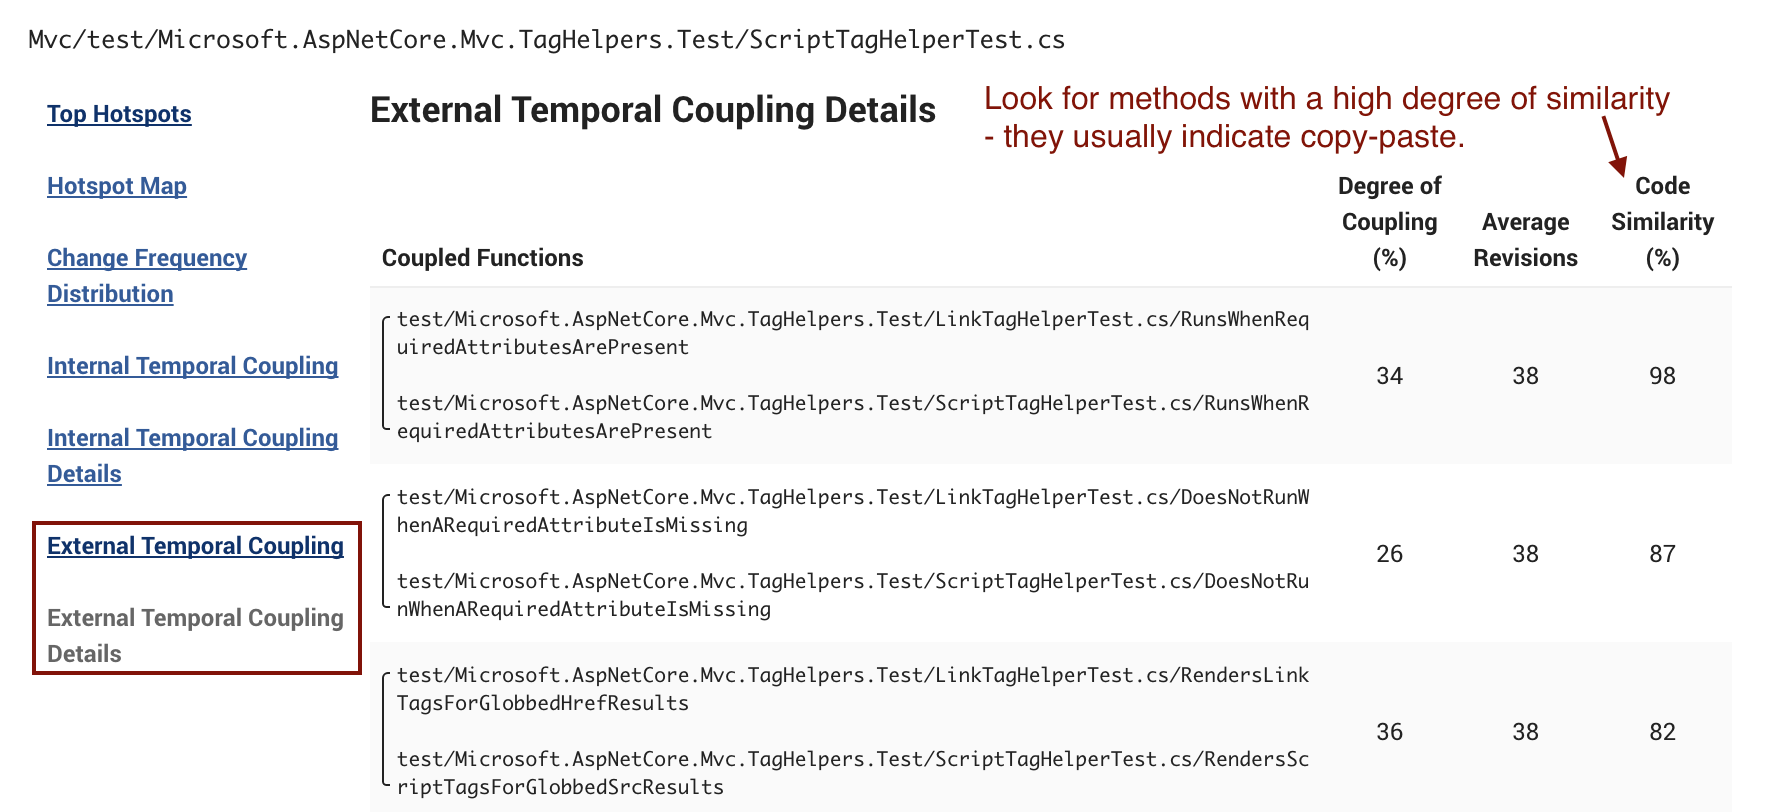
Fig. 27 The Code Similarity analysis let you uncover copy-paste code.
In Fig. 27 you see that there are two methods with the same name, but located in different classes, that have a code similarity of 98%. You want to use this data as a starting point. If you could encapsulate that shared logic in a separate method that you re-use between the two classes your temporal coupling will go away. Your application will become a little bit easier to maintain.
A word on Software Clone Detection
Copy-paste detection isn’t exactly a new technique. However, it’s still far from mainstream in the software industry. One reason that copy-paste detectors haven’t catched on is because they fail to prioritize their findings in a sensible way.
If you look at studies of large codebases, you’ll learn that around 5-20% of all large codebases represents duplicated logic to some degree. That’s quite a lot. There’s simply no way you can start to refactor that amount of code and hope to get a return on that investment. In fact, most of that duplicated code doesn’t matter. So how can we find the software clones that limit out ability to maintain the system?
Empear’s X-Ray solves this dilemma. By combining copy-paste detection with temporal coupling we know that the identified software clones matter. For example, if you look at the example above, you’ll see that the two methods with a code similarity of 98% are changed together in one third of all cases. That is, with X-Ray you’ll find the software clones that actually matter. This lets you prioritize the improvements that you do while still ensuring that you get a real return on those refactoring investments.
Know the limitations of Method-level analyses
The Empear tool suite tracks renamed content. That is, if you move or rename a file, we make sure to fetch its past history even if you’ve renamed the file multiple times. We implement a similar mechanism for X-Ray too. X-Ray will track and analyze the history of renamed methods/functions...except when it won’t. Let’s elaborate on that so that you know the possible corner cases.
First of all we have a philosophical question here. Let’s say you decide to refactor parts of your code. You simplify some parts of it and rename a few functions. Now, when is a function renamed and when is it actually a new function that replaces an old one? This distinction isn’t clear.
X-Ray resolves this dilemma by introducing a set of heuristics for its rename detection:
- We consider a method/function renamed if its name is changed without any changes to the method body.
- We also consider a method renamed if its name is changed and their are minor modifications to its method body.
- X-Ray doesn’t do rename detection for methods that it considers too small (e.g. single line getters/setters).
So if you want to ensure that your renamed methods are being tracked past the rename, please make sure that you do the renaming in one commit and possible method body modifications in another commit. It’s usually a good refactoring practice anyway.
In general, X-Ray tries to do the most sensible thing. Without the rules above, you’d risk false positives in your analysis results. That’s prevented now at the possible cost that X-Ray will miss the occasional rename. This is a better trade-off since if the renamed function is a Hotspot, it will most likely continue to change at a rapid rate and X-Ray detects that anyway.