Code Churn
Code churn is a measure that tells you the rate at which your code evolves. Code churn has several usages:
- Visualize your development process: Your code churn signature in the diagrams below mirrors the practices you use to deliver code. You may want to watch out for regular spikes, which may hint at a mini waterfall going on in your daily work
- Reason about delivery risks: Code churn is a good predictor of post-release defects. Thus, it’s a warning sign if you approach a deadline while your code churn increases. That’s a sign that the code gets more and more volatile the closer you get to your deadline. You want the opposite. You want to stabilize more and more code the closer you get to delivery.
Empear Enterprise provides several churn measures. They’re all described in this guide and you typically investigate all of them to get the overall trend in your codebase.
Use the Commit Activity as the Pulse of your Codebase
The commit activity chart shows the number of commits and contributing authors over time:
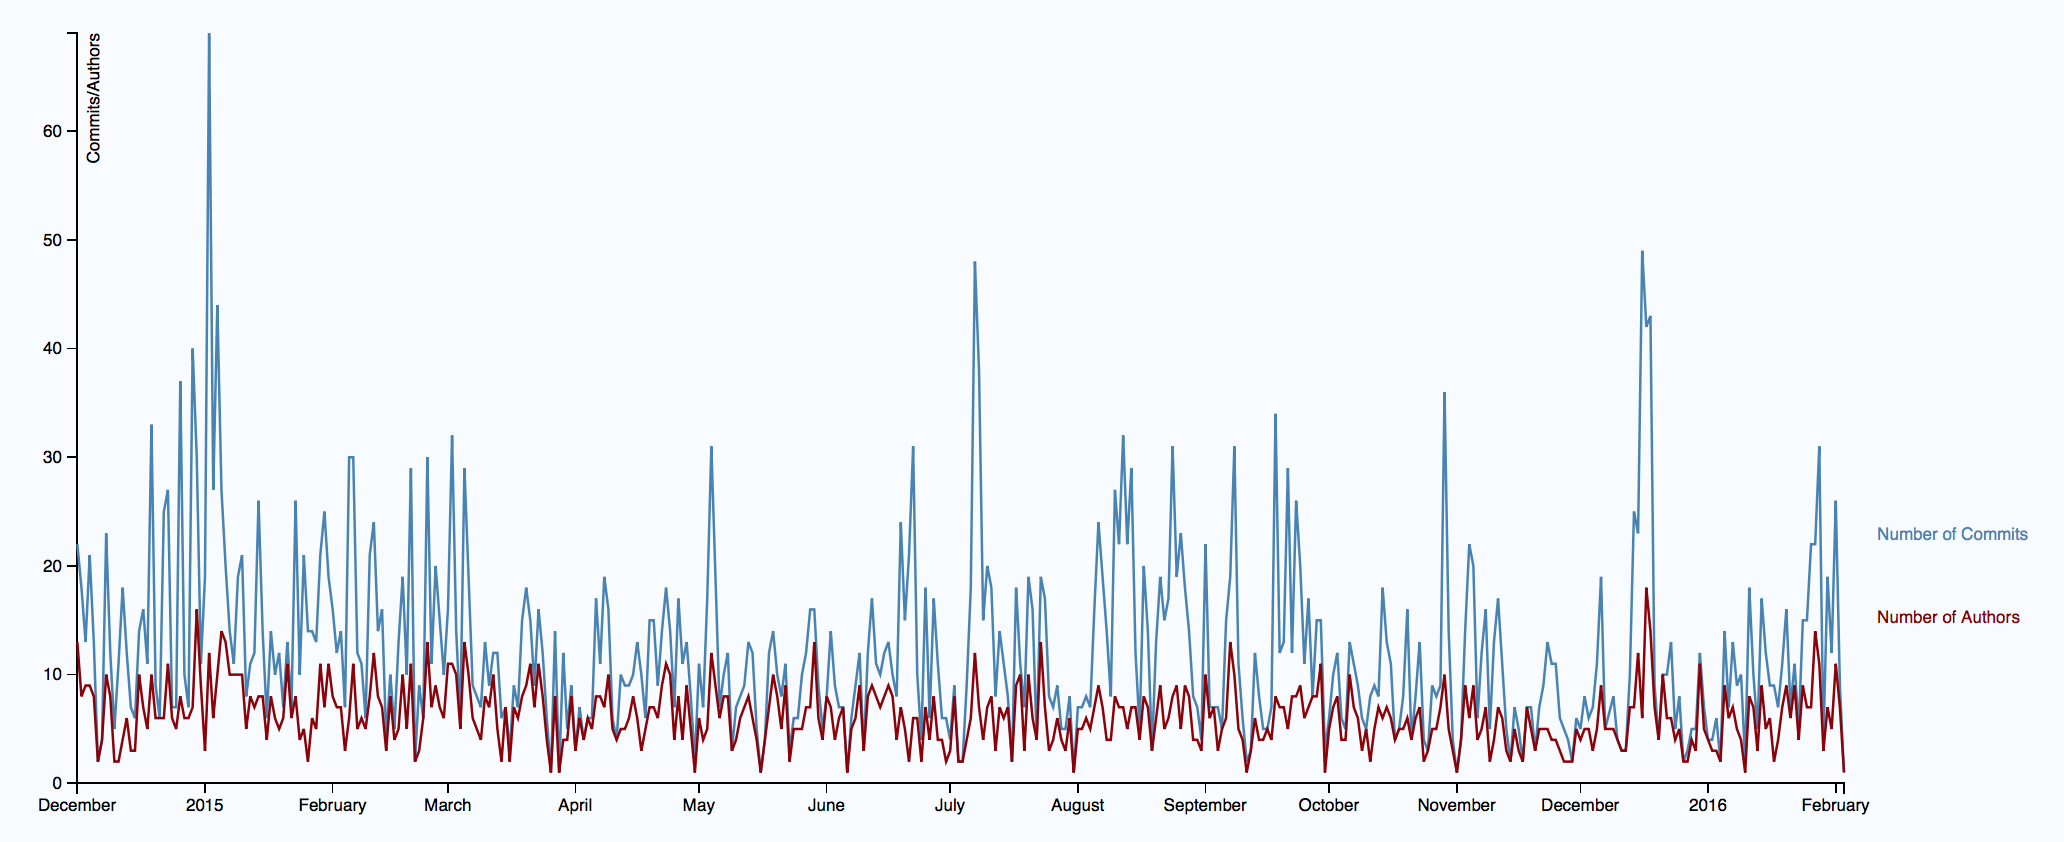
Fig. 19 The commit activity chart.
The number of commits and authors over time is a different kind of churn. This metric will typically correlate well with your other Code Churn metrics described below. However, you want to look out for potential productivity issues like an increase in authors without a corresponding increase in commits and churn; Such a trend often indicates that you’ve more programmers contributing than the software architecture (and/or organization) can support.
Uncover Long-term Trends in your Code Churn Rolling Average
Empear Enterprise measures two separate churn metrics: the number of added lines of code, and the number of deleted lines. The values in the graph shows the rolling average of your code churn (rolling average is a technique to smoth out sudden fluctations in your data). You configure a time window for the rolling average in your repository configuration options.
The main use of these code churn metrics is to reason about delivery risks; If you’re close to a deadline and have a rising churn, you might want to understand why. After all, an increase in churn means that the codebase has become more and more volatile. Unless you have an extensive safety net in terms of tests and continuous deployment techniques, you probably want to stabilize before a release.
Code Growth is relative to your Starting Date
The final churn metric is a visualization of Code Growth:
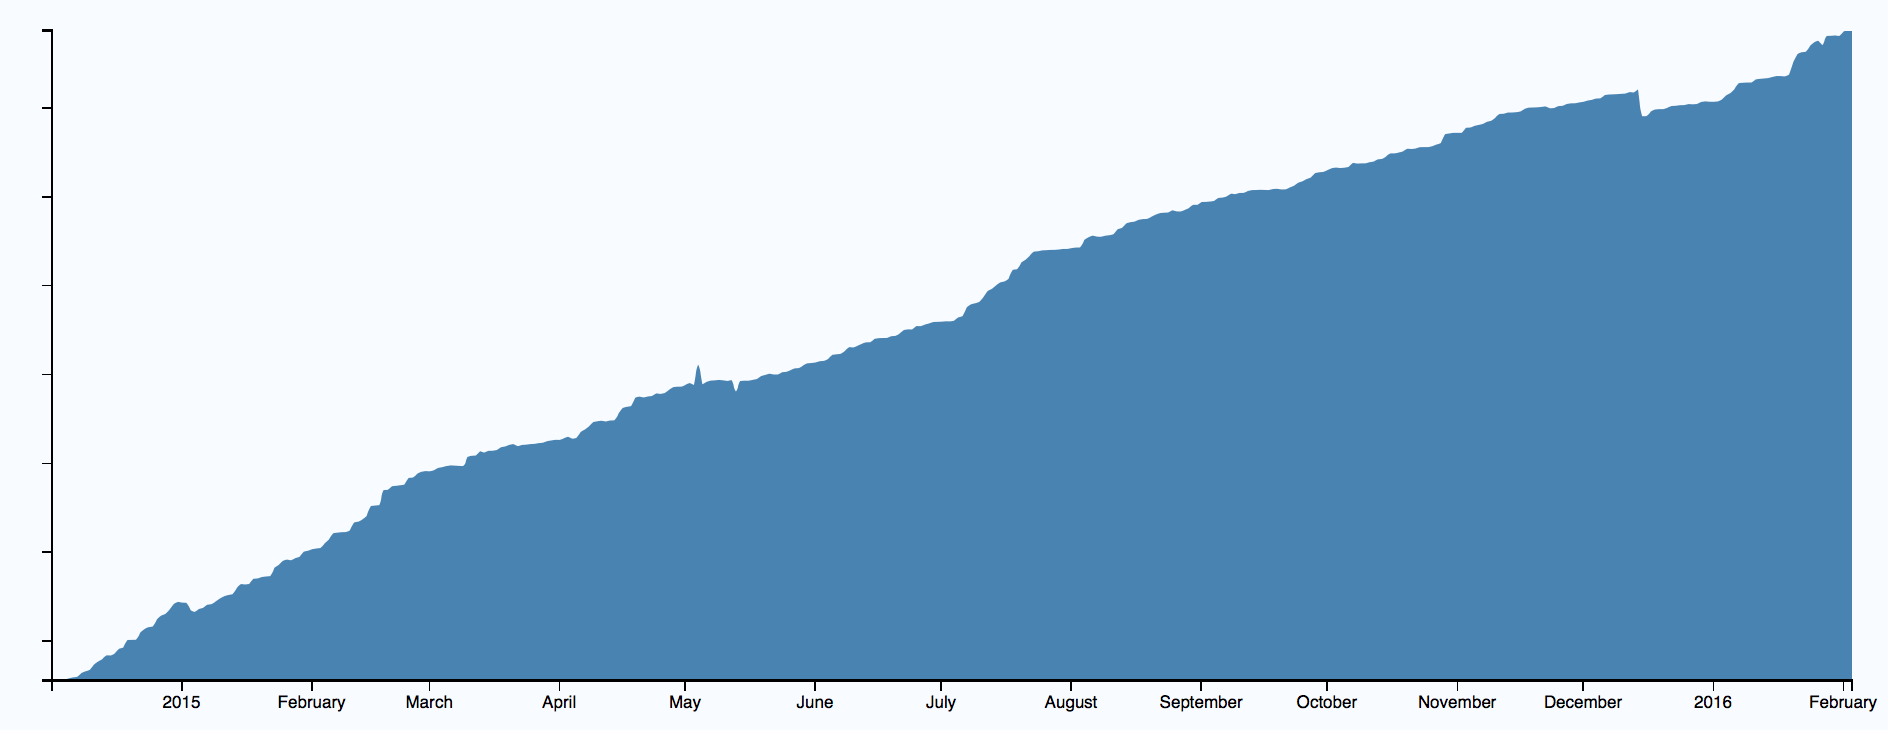
Fig. 20 The growth of your codebase.
Code Growth shows the accumulation of lines of code over your analysis period. It’s important to note that the trend is relative to your starting date. For example, if you have five years of development history but only analyze the last four, the code growth is calulcated using that first year’s contributions as offset zero.
Also, note that a code growth can be negative. That’s usually a good sign, since less code means fewer problems to attend to. Prioritize Improvements by Classified Hotspots
In a large system, our analyses will find a lot of potential for improvements and savings. The potential problems may be either technical (e.g. complicated code, unexpected temporal coupling) or social (excess coordination needs, severe areas of abandoned code). The following guide helps you prioritize all those possible problems and improvements so that you know where to focus your efforts and rest assured you get a return on that investment.