Repositories
Specify the Git Repository to analyze
Your first step is to tell Empear Enterprise where your code is. You do that by specifying the path to your physical Git repository, which has to be on the same machine as Empear Enterprise runs on. The path you specify has to be to the root folder of your repository (i.e. the folder that contains your .git folder).
Analyze Projects organized in Multiple Git Repositories
There’s a recent trend towards organizing the source code of larger systems in multiple Git repositories. For example, you may have the code for your user interface in one repository, the code for your service layer in another repository and perhaps even a Git repository dedicated to your back end mechanism. Another typical example is Microservices where each service is deployed according to its own life cycle. In that case, organizations often chose to use one Git repository per service.
Empear Enterprise supports an analysis of multiple repositories at once. All you have to do is to specify the paths to them:
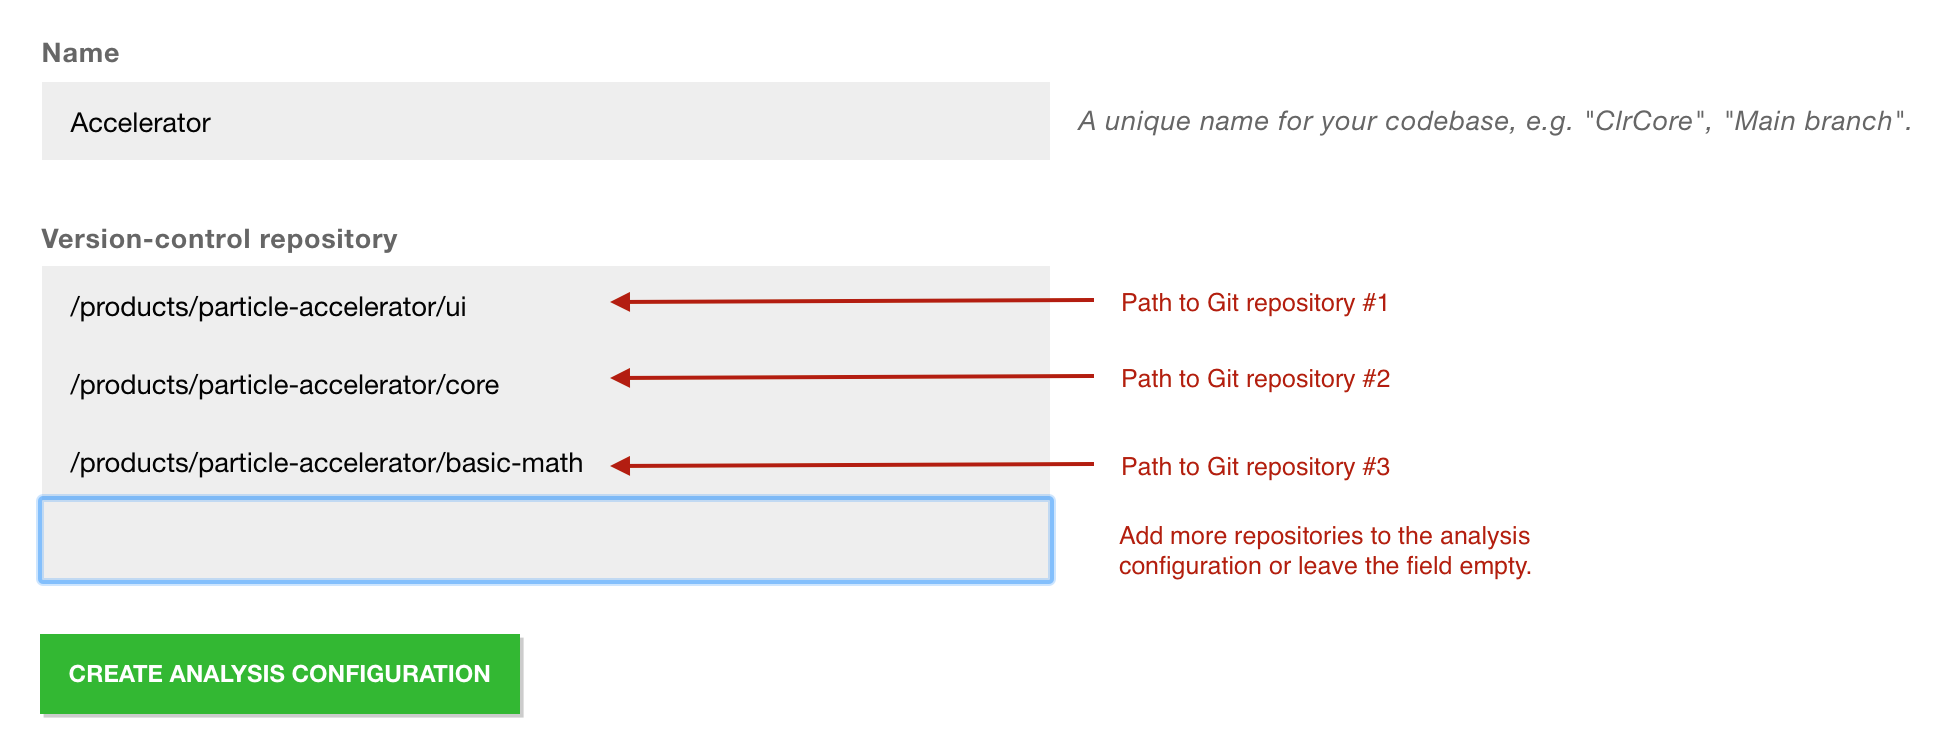
Fig. 38 Configuration of multiple repositories.
The screenshot above shows three repositories that belong to the same product. During an analysis, Empear Enterprise will analyze the evolution of the code in all those repositories as though they were in the same physical Git repository.
You can specify as many repositories as you want and remove one at any time (just erase the text in that box). However, a word of warning: do NOT attempt to analyze unrelated repositories in the same configuration. First of all it’s a breach of the license agreement. Worse, you won’t get useful results since many of the basic metrics, like Hotspots, are relative metrics.
Measure Temporal Coupling across Multiple Repositories
The normal temporal coupling metric considers two files coupled if they tend to change in the same commits. This won’t work if your codebase is split across multiple repositories. Instead, you want to aggregate individual commits into logical commits. Empear Enterprise supports two different mechanisms for that:
- Temporal Coupling by Author and Time: When you specify this option, the tool will consider all commits by the same author on the same day as a single, logical commit. This option is a heuristic that works well in the absence of a Ticket ID in your data.
- Temporal Coupling by a custom Ticket ID: This option uses an identifier in your commit headers. All commits that refer to the same identifier will be considered one, logical commit.
Option 2 - Temporal Coupling by a custom Ticket ID - is the preferred method. It requires you to specify a pattern used to extract the Ticket ID from the commit message:
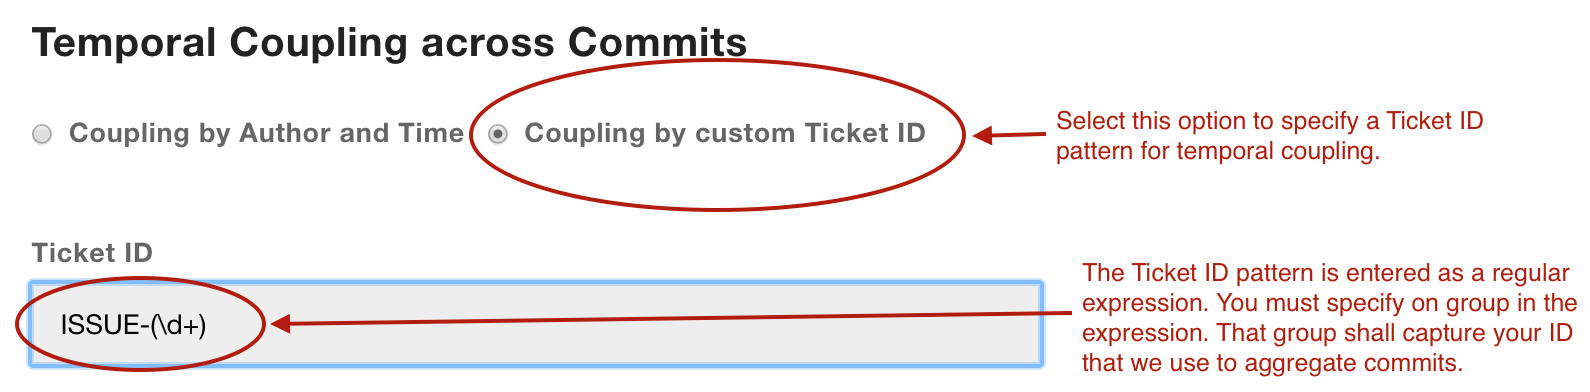
Fig. 39 Configure a pattern to extract a Ticket ID.
The example pattern in the screenshot about will extract all identifiers that 1) start with the text ‘ISSUE-‘ followed by 2) at least one digit. For example, the commit message ‘ISSUE-42’ will result in the Ticket ID ‘42’.
Note that Empear Enterprise will still calculate normal temporal coupling on a single commit basis. You want that in order to spot unexpected dependencies between files in the same repository. The temporal coupling results for the logical commits discussed above are presented in a separate analysis view.
Exclude Files from an Analysis
An analysis will include all textual content in your repository. That means: you get an analysis of your build scripts, resource files, configuration files, test data, etc. While it’s a good practice to run an analysis of all content every now and then, there’s also the risk that you get too much noise in the analysis results. For example, you typicall want to exclude auto generated content.
The Exclude Files option lets you specify a set of file extensions that will be excluded from your analysis:
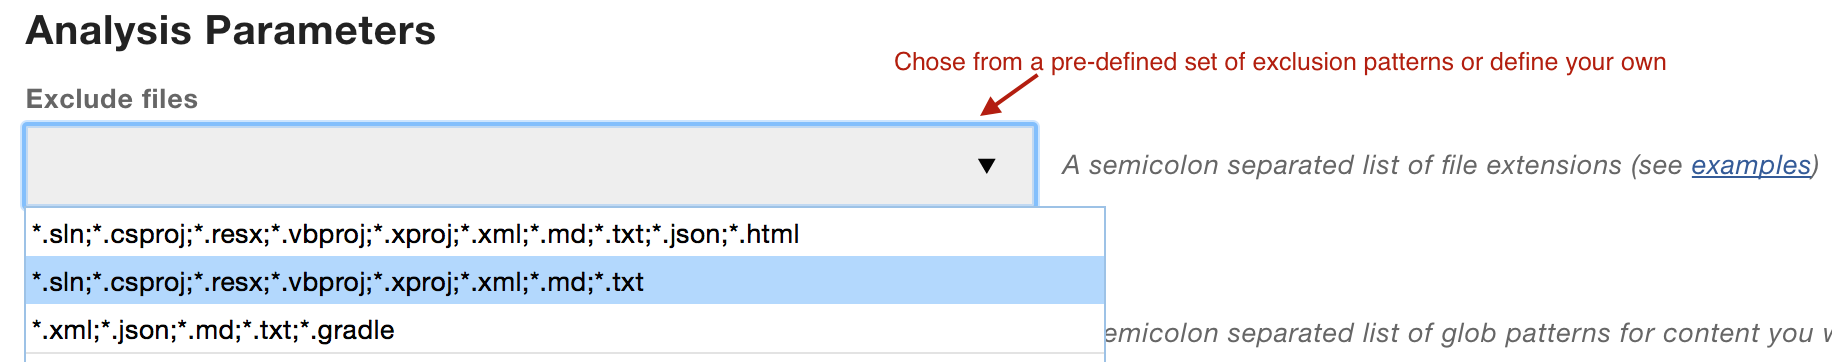
Fig. 40 Exclude specific types of files.
Empear Enterprise comes with a set of pre-defined exclusion patterns that should match the most common cases. You’re free to extend this set if you have additional file types that you want to exclude. Just remember to use a semi-colon (;) to separate each file extension you want to exclude.
Exclude Content from an Analysis
You just learned how you can exclude certain types of files, no matter where they are located in the your codebase. But sometimes you want to be more specific in what you exclude. Here’s how you do that.
The default behavior of an analysis is to include all content of your repository. But sometimes you’d like to exclude a particular file or, more often, a complete folder. For example, let’s say that you check-in third party code in your repository. You don’t want that code to obscure potential analysis findings in your own code.
You specify a glob pattern to Exclude Content from the analysis:
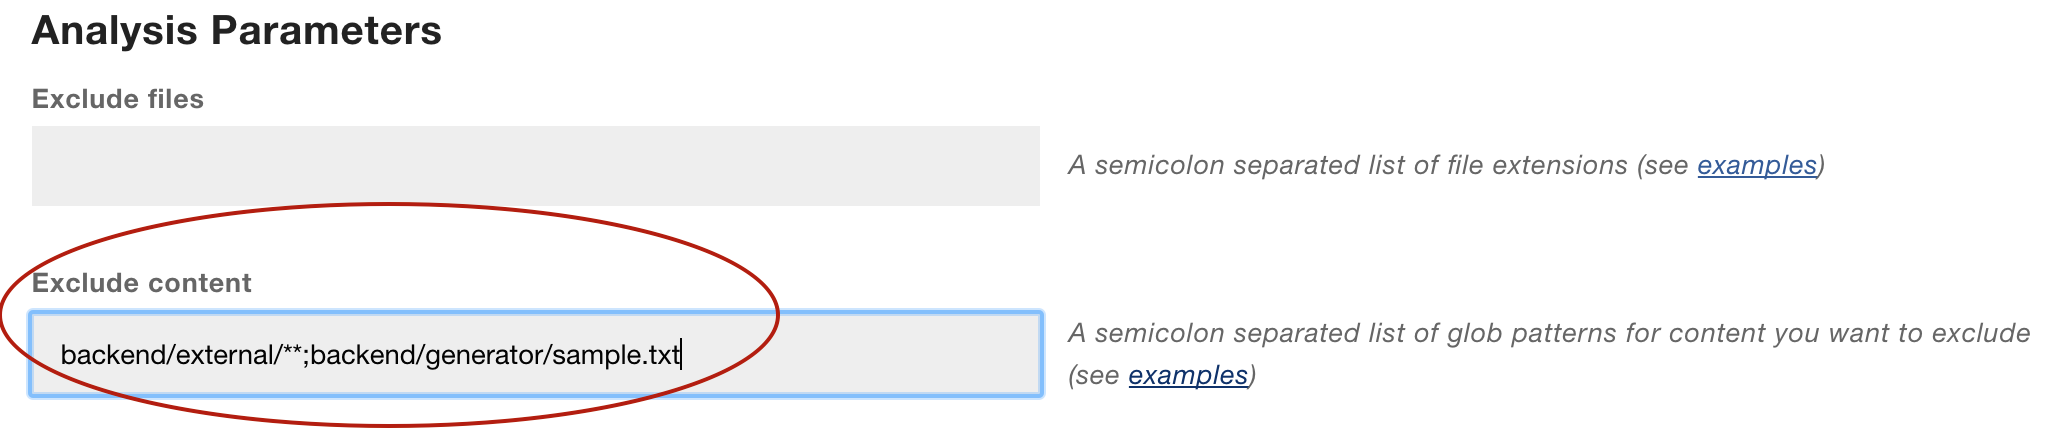
Fig. 41 Patterns to exclude content.
The example above will exclude all content under the external folder and the file samples.txt from the generator folder.
Note: You need to specify your exclusion paths using UNIX style path names. That is, use forward slashes as separators. Also note that the paths have to start with the name of your repository root. That is, if your Git repository is located in a folder named backend, as in the example above, you have to pre-prend that folder name to all your exclusion patterns. The reason for that is due to Empear’s support for multiple repositories where you have to be explicit about what repository you exclude things from.
Visualization Options
Empear Enterprise is capable of analyzing large codebases consisting of millions lines of code. However, the web browser you use to view the results isn’t always that performant. In particular, if you have a repository with several thousands of files, the Hotspot and Knowledge visualizations will become slow and painful to navigate.
If you experience that problem, consider to increase the thresholds in the Visualization Options:
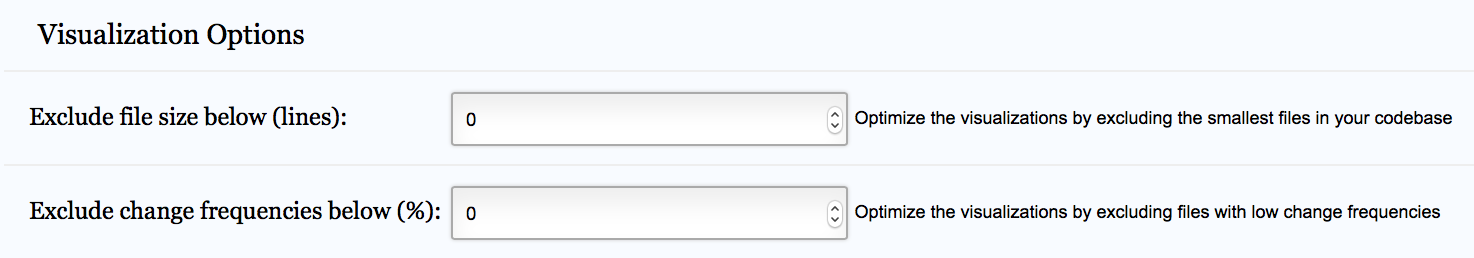
Fig. 42 Exclude small files from a visualization.
The first option simply excludes files smaller than your specified size from the visualizations. The second option excludes files that haven’t changed more often than the threshold you enter.
The rationale is that in a system of several thousand files, the small ones (1-100 Lines of Code) are probably not the most interesting ones. Thus, these should be safe to exclude.
Note that the visualization algoritm performs some checks to ensure that a hotspot, no matter how small, is included anyway so that you don’t miss some important result. Also note that the exclusion only applies to the visualization - the code is still included in the analysis.